"My order was triggered but I never saw that price on the chart!"
You’re not imagining things. But here’s the mechanic that explains everything.
Let’s start with what happened
You set a limit order or a stop at a very specific price. A few hours later, your order gets triggered. You go back to the chart. You zoom in. You scroll. That price is nowhere to be seen.
This can be absolutely frustrating because of the confusion it creates.
But there’s a logical explanation and once you understand it, you’ll never be confused by it again.
What your chart is actually showing you
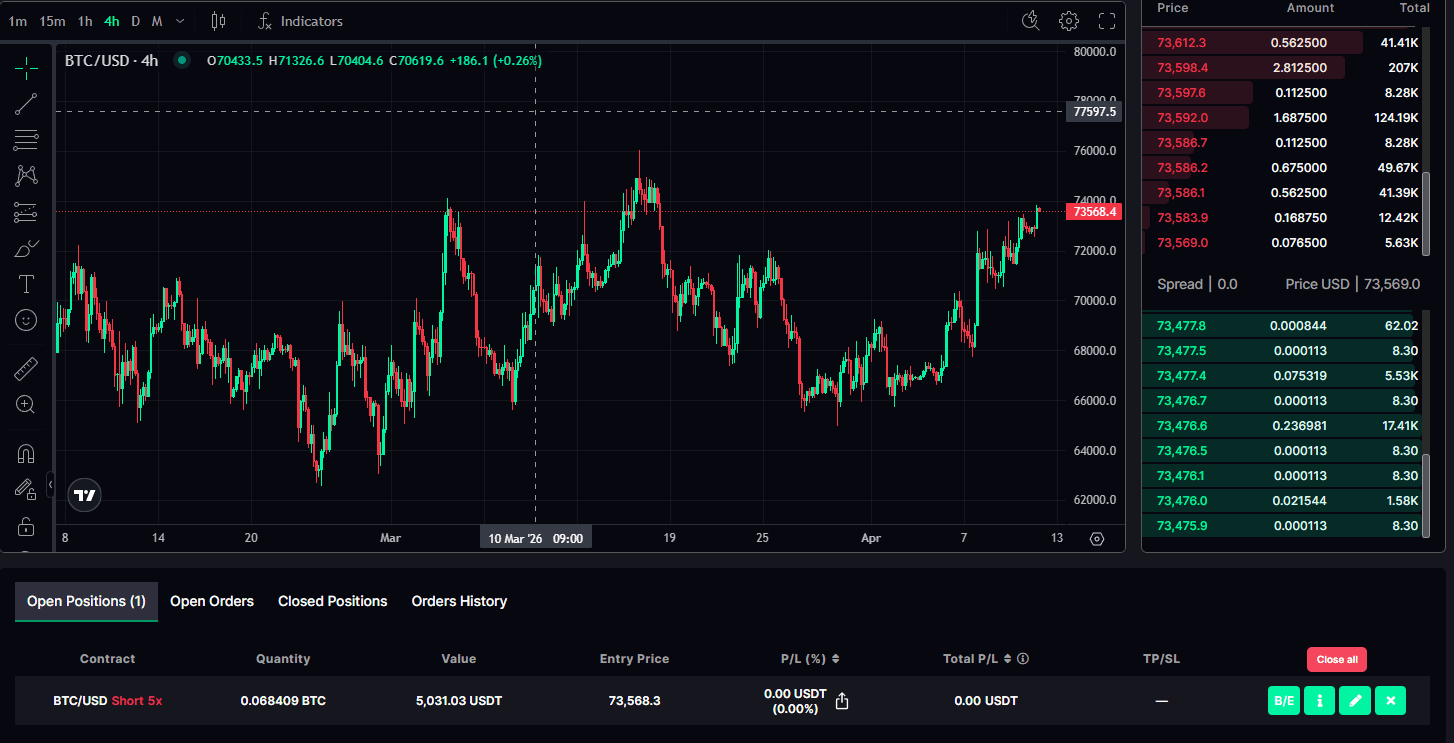
Most traders don’t realise this: the chart does not show you the market. It shows you the mid price.
The mid price is the arithmetic average of the two best prices in the order book at any moment:
So if the best buyer is offering 1,999 and the best seller is asking 2,001, the chart displays 2,000.
That’s right in the middle. But that 2,000 is a mathematical construct. Nobody is actually buying or selling at exactly 2,000.
The 2,000 exists only as a reference point but not as a transaction price.
Your chart shows the mid price. Your order executes at the actual transaction price whether bid or ask.
So why did my order trigger?
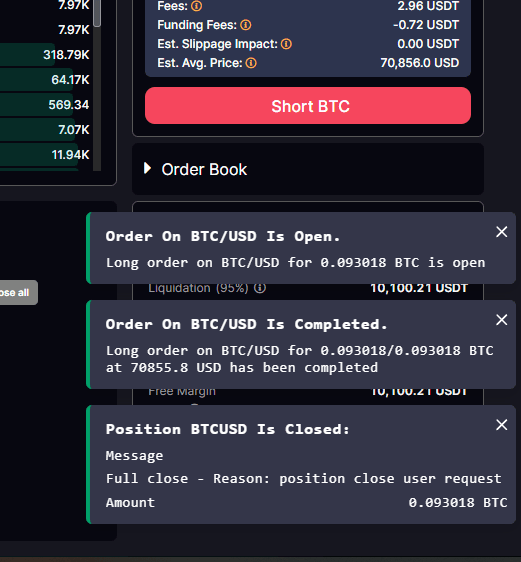
Orders execute against the order book and not the mid price. Here’s how it works for each order type:
So if your stop sell is set at 2,000, it may trigger the moment the bid touches 2,000 even if the mid price on the chart still reads 2,000.50 or higher. From your screen, it looks like the price “never got there.”
But it did on the bid side of the book.
And then there is!
Spread: not fixed, and not small during volatility
Spread is the gap between bid and ask and it's not constant. It widens and tightens with market conditions
Calm markets with high liquidity → tight spread (a few cents or less)
Volatile markets, geopolitical events, or off-hours trading → spread can widen significantly.
A wider spread means a larger gap between what you see on the trading chart (mid) and where your order actually executes. The more volatile the market, the bigger that invisible gap becomes.
During periods of extreme volatility, a major economic announcement, a sudden geopolitical event, or an overnight liquidity crunch, the spread can be tens or even hundreds of times wider than normal.
An order can trigger at a price that feels completely disconnected from what the chart was showing.
When is spread risk highest?
Watch out for these moments in particular
Asian session, market opens and closes, its lower liquidity across the book.
Major macro announcements: Fed rates, CPI, NFP, geopolitical escalations.
Flash crashes or sudden large moves, which makes market makers widen spreads to manage risk.
Markets get thin during the holidays, so expect wider and more unpredictable spreads.
What can you do about it?
You can’t eliminate the spread since it’s an intrinsic feature of any live market. But you can work with it:
Factor the spread into your entry and exit levels, especially when using tight stops.
Avoid placing critical orders around high-impact news events.
And you can always use the order book view on Ouinex to see live bid/ask prices and not just the mid price chart.
Contact Ouinex Support if you require any further help or clarifications.
TL:DR
Ouinex charts show the mid price which is the average between best bid and best ask.
Your orders execute against the real order book, at the bid or ask.
This means an order can trigger even if the chart never visually touched your level.
The gap between what you see and where you execute can feel significant. If you consider the dynamic spread that widens during volatile or low-liquidity periods, and tightens in vise versa.
But that is how live markets work.