Relative Strength Index (RSI)
A momentum indicator used in technical analysis to measure the speed and change of price movements.

What Is the Relative Strength Index (RSI)?
Relative Strength Index (RSI): The RSI is a momentum oscillator used in technical analysis to measure the speed and change of price movements. It helps traders assess whether an asset is overbought or oversold, which can indicate potential reversal points.
How It Works
- Scale: RSI is measured on a scale from 0 to 100.
- Overbought: When the RSI is above 70, it suggests the asset may be overbought (price might soon decline).
- Oversold (lots of people have sold off this asset): When the RSI is below 30, it indicates the asset may be oversold (price could rise).
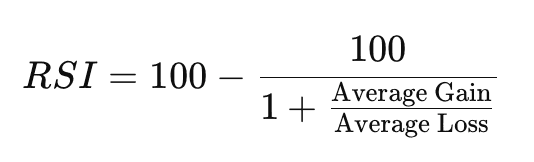
- Calculation: RSI is calculated based on the average gain and loss over a specified period, typically 14 days. The formula is:
- Interpretation: Traders use RSI to spot potential buy or sell signals:
- Buy Signal: When RSI drops below 30 and then rises above it, indicating the asset may be undervalued.
- Sell Signal: When RSI rises above 70 and then falls below it, indicating the asset may be overvalued.
Example
If a stock's RSI is 80, it might be considered overbought, and a trader might anticipate the price to decline soon. Conversely, if the RSI is 20, the stock could be considered oversold, and a rebound might be expected.
In short, RSI helps traders spot whether an asset is too expensive (overbought) or too cheap (oversold), guiding them in their buy and sell decisions.
Other terms in this Category.