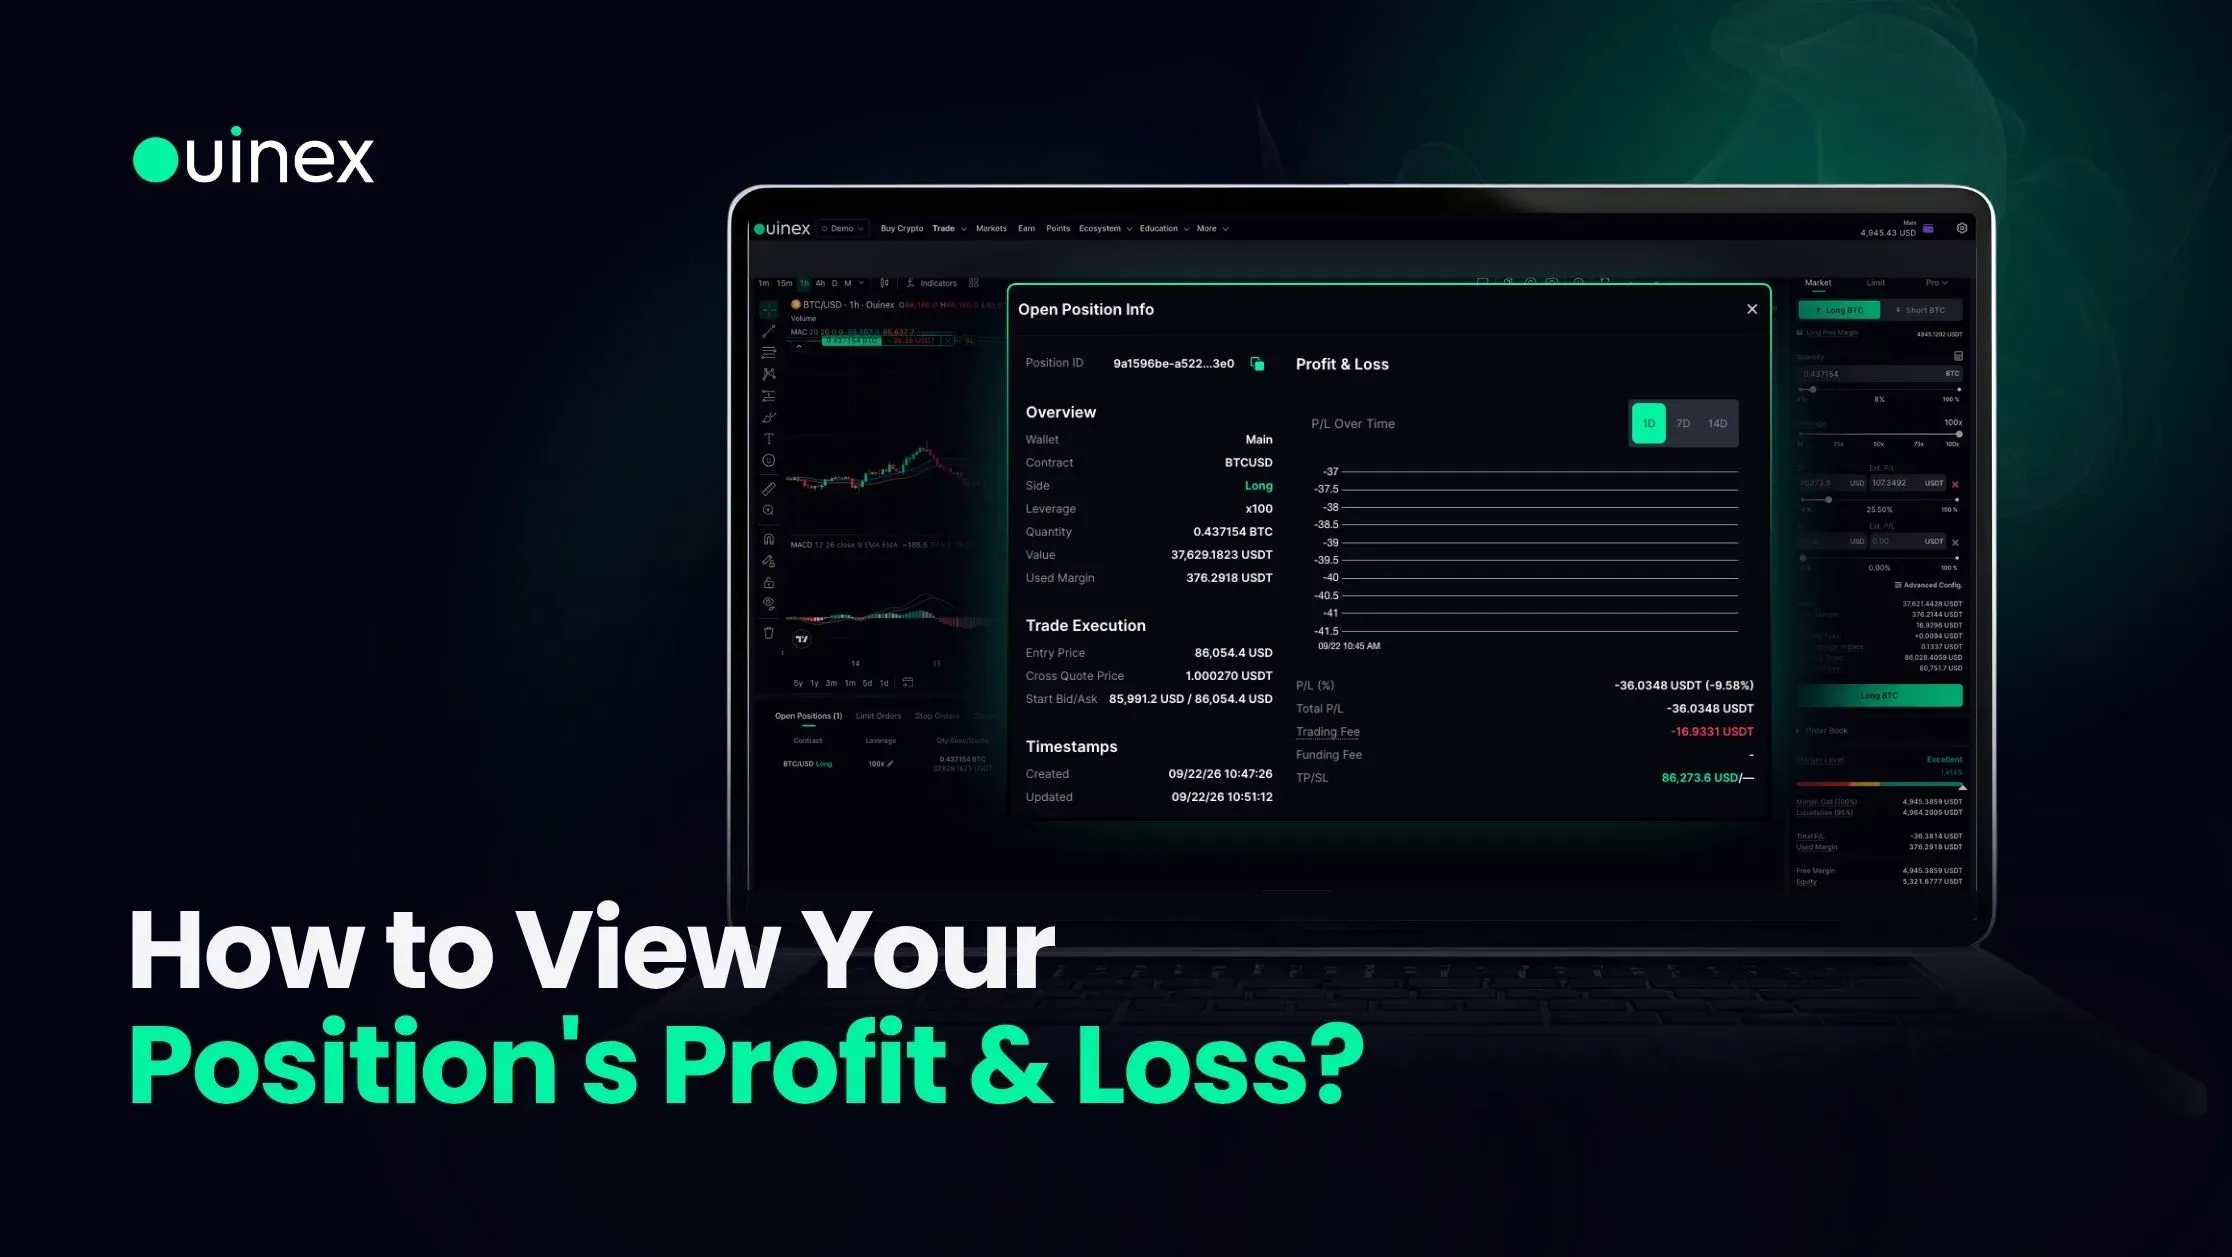
Click the info icon on any open position and the Open Position Info window opens, with a P/L Over Time chart, the full execution record of your entry, and a breakdown of what the position has actually cost you in trading and funding fees.
The difference between a number and a chart is larger than it sounds. A position showing +1.2% tells you almost nothing. A position showing +1.2% after spending three days at −4% is a different trade, and knowing which one you are in changes what you should do about it.
Watch the walkthrough: How to View Your Position's Profit & Loss on Ouinex
What the window shows
Overview, on the left: the wallet, the contract, the side, your leverage, quantity, value, and used margin.
Trade Execution: your entry price, the cross quote price, and the start bid and ask. This is the record of how you actually got filled, as opposed to the price you were looking at when you clicked.
Timestamps: when the position was created and when it was last updated.
Profit & Loss, on the right, is the new part. It contains the P/L Over Time chart, switchable between 1 day, 7 days and 14 days with the toggle at the top right, and beneath it the live figures: P/L as a percentage, Total P/L, your trading fee, your funding fee, and your TP/SL.
Why the fee lines are separated
Trading fee and funding fee are shown as their own lines rather than being folded into the P/L, and that separation is the most useful thing in the window for anyone holding positions for more than a day.
The trading fee is charged when you open and close. It is a fixed, known cost.
The funding fee accrues for as long as the position is open. On a position held for an afternoon it is usually negligible. On a position held for three weeks it can be a material share of the result, and it accumulates whether the trade is working or not.
Seeing them separately answers a question that a single P/L figure hides: was this trade a good call that funding ate into, or a mediocre call that looks worse than it was? The fees page covers the structure, including the markets where there is no commission at all, forex, stock indices and commodities, where you pay the spread and nothing else.
Reading the P/L over time chart
The three timeframes are not just zoom levels.
1 day shows you the position's behaviour now. Useful for a trade you are actively managing.
7 days shows you the shape of the move you are in. This is usually the most informative of the three, long enough to show a trend, short enough that the detail is still visible.
14 days shows you the cost of patience. On a longer-held position, the 14-day view is where the funding drag becomes visible as a slow slope against you even in flat markets.
The most valuable thing the chart gives you is the drawdown your position has already survived. If a trade is currently at +2% but spent last Tuesday at −6%, you now know that the stop you thought was comfortable was nearly hit, which is information about your sizing, not about the market.
Using it on positions you plan to hold
For a day trade, the chart is interesting. For a multi-day position, it is the tool.
Check it before you decide to hold something over a weekend. Look at the funding fee line, look at the 7-day slope, and ask whether the position is earning enough to justify what it is paying to stay open. The estimated liquidation price on the position tells you the same story from the risk side, as funding accumulates and margin is consumed, it moves closer to the market even when the price has not moved at all.
Those two figures together are the honest picture of a held position. Neither is visible from the Open Positions row on its own.
FAQ
How do I see the profit and loss on a specific position on Ouinex? Go to the Open Positions tab, find the position, and click the info icon. The Open Position Info window opens with a P/L Over Time chart, your live P/L figures, and a breakdown of trading and funding fees.
What timeframes does the P/L chart show? 1 day, 7 days and 14 days, switched using the toggle at the top right of the Profit & Loss section.
What is the difference between the trading fee and the funding fee? The trading fee is charged when the position is opened and closed, a fixed, known cost. The funding fee accrues for as long as the position stays open, so it grows with holding time and applies regardless of whether the trade is profitable.
Why is my P/L different from the price move on the chart? Because your result is net of costs. The trading fee and the accrued funding fee both sit between the price move and your actual P/L, which is why they are shown as separate lines in the position info window.
What is the cross quote price? It appears in the Trade Execution section alongside your entry price and the start bid and ask, and forms part of the record of how your order was actually filled.
The bottom line
The position info window turns a live number into a history, and the history is where the useful information is. Read the funding fee line on anything you have held more than a day or two, use the 7-day chart to see the drawdown the position has already been through, and check it together with the liquidation estimate before deciding to hold over a weekend. It is available on every open position across Ouinex derivatives.