Most technical indicators tell you one thing: momentum, or trend, or where support and resistance might sit. The Ichimoku Cloud tries to tell you all three at once, which is exactly what its creator intended when he named it "one glance equilibrium chart." That ambition is also why it looks intimidating the first time you see it on a chart: five lines and a shaded region, all moving at once, instead of the single line most traders are used to reading.
This guide breaks the indicator down into its five components, explains how to read the cloud itself, and lays out a basic trading approach that doesn't require using all five lines before you've understood any of them individually. If you want to trade stock index CFDs on Ouinex once the trend direction is clear, the strategy section below is where that decision gets made.
What Is the Ichimoku Cloud?
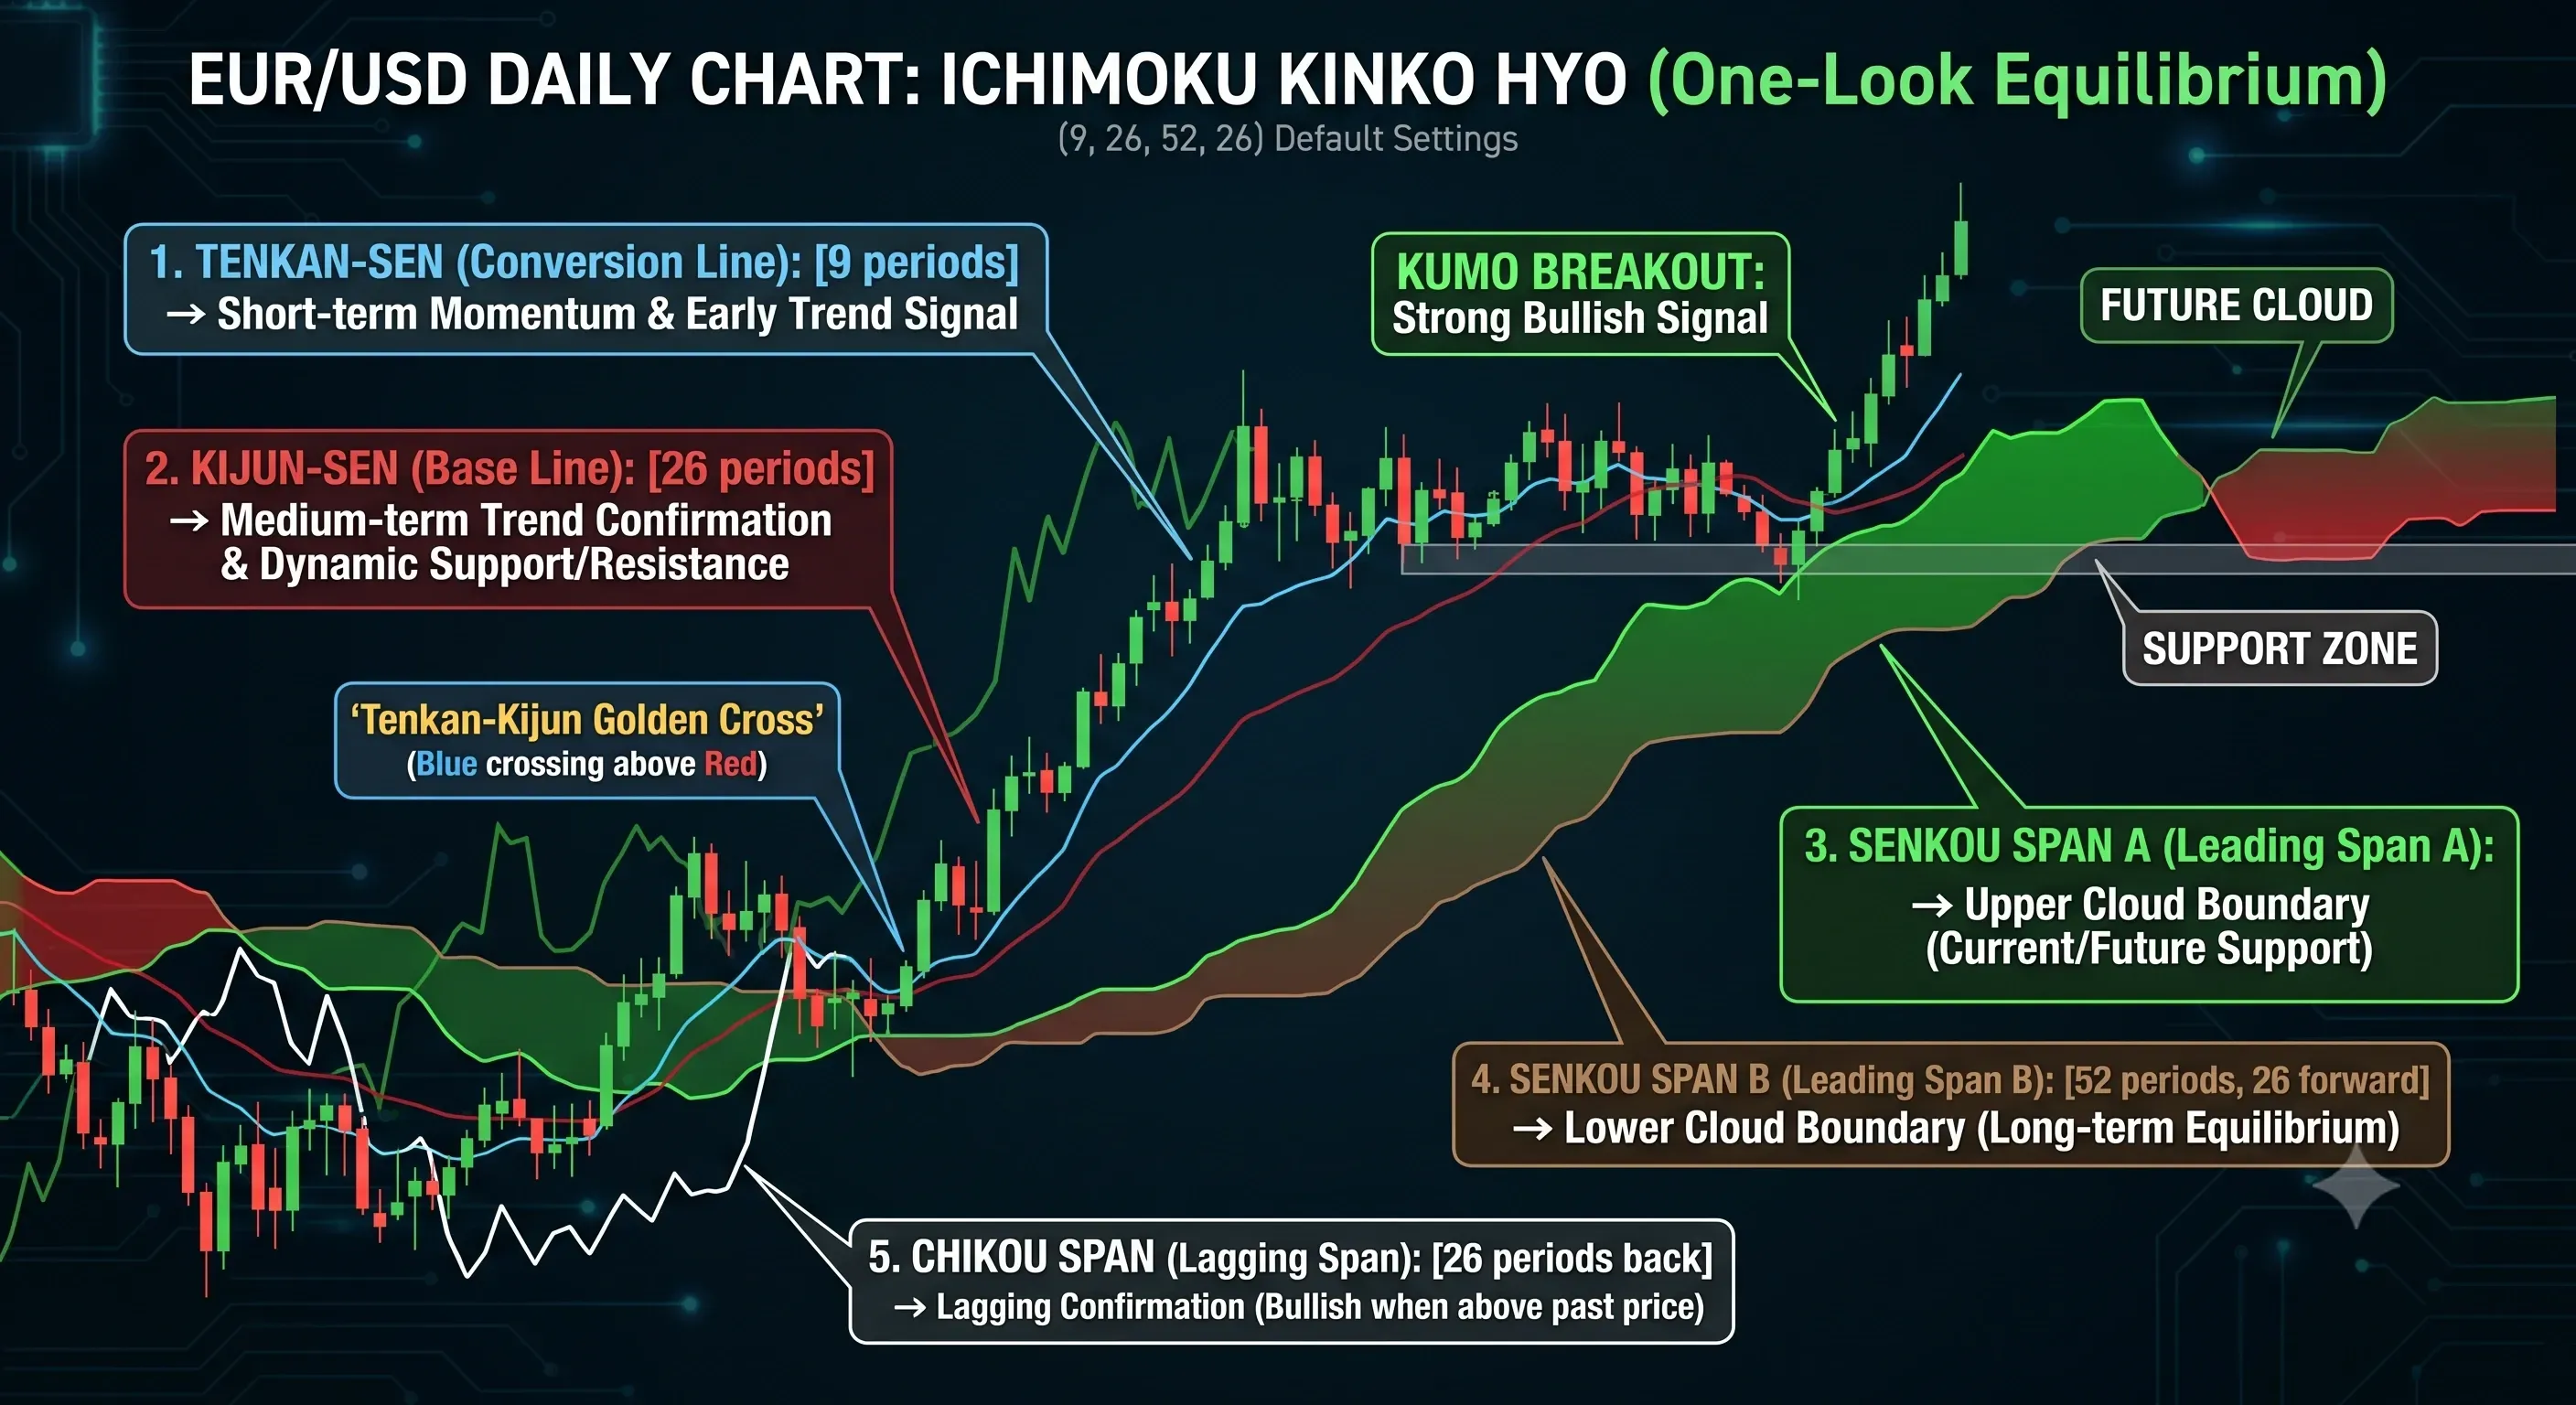
The Ichimoku Cloud is a technical indicator that combines five lines to show trend direction, momentum, and support/resistance in a single glance.
It was developed by Japanese journalist Goichi Hosoda in the late 1930s and published in 1969 under the name "Ichimoku Kinko Hyo", literally "one glance equilibrium chart," a name that describes exactly what the indicator was designed to do: let a trader assess the overall state of a market at a glance, rather than piecing that picture together from several separate tools.
The core idea behind the indicator is that trend direction, momentum, and key price levels are related enough to be shown together on the same chart rather than as separate, disconnected signals. Where most indicators isolate one dimension of price action, the Ichimoku Cloud layers several on top of each other, which is also why it takes longer to learn than a single moving average but tends to reward traders who put in that time with a genuinely more complete read of the chart.
What most introductions to the indicator leave out is how long it actually took to build. Hosoda reportedly began developing the underlying concepts in the 1930s, kept the work private for two decades, and eventually hired a team of students to manually backtest the formulas, a process that ran for over 20 years before the indicator was finally published in 1969. That's a genuinely unusual development timeline for a technical indicator, most of which are formalized and published within a year or two of being conceived. It's also a useful piece of context for why the default settings (9, 26, and 52 periods) feel arbitrary at first glance: they're the product of decades of manual testing against real price data, not a round number chosen for convenience.
The Five Components of the Ichimoku Cloud
Each of the five lines measures something slightly different, and understanding what each one represents individually makes the indicator as a whole far less overwhelming. If terms like "trend" or "support and resistance" aren't fully familiar yet, Ouinex's trading glossary is worth keeping open alongside the breakdown below.
- Tenkan-sen (conversion line): the average of the highest high and lowest low over the last 9 periods. Reflects short-term momentum and reacts fastest to recent price changes of the five lines.
- Kijun-sen (base line): the average of the highest high and lowest low over the last 26 periods. Reflects medium-term trend and moves more slowly than the Tenkan-sen, acting as a smoother reference line.
- Senkou Span A: the midpoint between the Tenkan-sen and Kijun-sen, plotted 26 periods ahead of the current price. Forms one edge of the cloud.
- Senkou Span B: the average of the highest high and lowest low over the last 52 periods, also plotted 26 periods ahead. Forms the other edge of the cloud, together, Senkou Span A and Senkou Span B form the shaded region known as the "kumo," or cloud.
- Chikou Span (lagging line): the current closing price plotted 26 periods back on the chart. Used to confirm trend by comparing its position to price action from that earlier point.
How to Read the Ichimoku Cloud
Once the five lines are on the chart, three things determine most of what the indicator is telling you.
Price position relative to the cloud. Price trading above the cloud is generally read as an uptrend, price trading below the cloud as a downtrend, and price trading inside the cloud as a period with no clear trend, often a consolidation phase where the indicator itself is less useful until price breaks clearly to one side.
Cloud thickness. A thick cloud signals stronger support or resistance, more historical price agreement backing that zone, and tends to be harder for price to break through cleanly. A thin cloud offers comparatively weak support or resistance and is more easily broken, which also tends to correspond with periods of low volatility building up before a bigger move. For a broader look at how the Ichimoku Cloud fits alongside other tools, Ouinex's guide to technical analysis indicators covers the wider toolkit this indicator belongs to.
The Tenkan-sen/Kijun-sen crossover. Known as the "TK cross," this is the most commonly used entry signal on the indicator: the faster Tenkan-sen crossing above the slower Kijun-sen is read as bullish, and crossing below is read as bearish. A TK cross that happens above the cloud, in the direction of the broader trend, is generally considered a stronger signal than the same cross happening inside or below it.
The Chikou Span plays a smaller but still useful confirming role. Because it plots the current close 26 periods back, checking whether the Chikou Span sits above or below the price action from that earlier point offers a second, independent read on trend; if the Chikou Span is above price from 26 periods ago while the other four lines also point to an uptrend, that agreement across components is generally read as a stronger overall signal than any single line taken alone. When the Chikou Span disagrees with what the cloud and the TK cross are suggesting, that's usually a cue to wait rather than to override the disagreement with a trade.
Ichimoku Cloud Trading Strategy
A basic approach to trading the indicator uses each component for a specific job rather than trying to read all five lines as one combined signal.
The starting rule most traders apply is to only take trades in the direction of the cloud trend, long positions when price is trading above the cloud, short positions when it's trading below. From there, the TK cross is used for entry timing within that broader trend, and the near edge of the cloud is used as a natural stop-loss reference, since a break back into the cloud generally invalidates the trend read that justified the trade in the first place.
Example trade walkthrough (stock index CFD). Say a major stock index is trading well above a moderately thick cloud, confirming an uptrend. The Tenkan-sen crosses above the Kijun-sen while both lines sit above the cloud, a TK cross in the direction of the established trend. A trader taking this as an entry signal might place a stop-loss just below the near edge of the cloud, on the logic that a move back inside the cloud would undercut the uptrend the trade was based on, with no fixed price target beyond trailing the stop as the cloud itself rises with the trend.
Because the cloud edge moves as the trend develops, the stop-loss distance on an Ichimoku-based trade isn't fixed the way it is with some other setups, it changes with the shape of the cloud itself, which means position size should be recalculated against the current cloud-edge distance rather than assumed to match a previous trade on the same instrument. A TK cross is also a noticeably stronger signal when it lines up with a reversal or continuation setup from the chart patterns cheat sheet, pattern confluence and Ichimoku confluence tend to reinforce each other rather than working as separate systems.
Trading trend signals with leverage magnifies both gains and losses, a TK cross is a probability signal, not a guarantee, so always define your stop-loss at the cloud edge.
Common Mistakes When Using the Ichimoku Cloud
The indicator's biggest strength, showing several things at once, is also where most beginners go wrong with it.
Trying to use all five lines at once before understanding any of them individually. The indicator is genuinely more approachable learned one component at a time, trend from the cloud, momentum from the Tenkan-sen, entry timing from the TK cross, than absorbed as one dense signal on day one. Traders who skip straight to trading the full indicator tend to freeze up or misread it the first time two of the five lines send conflicting signals.
Treating a thin or twisting cloud as a reliable signal. A thin, twisting cloud usually reflects consolidation and indecision rather than a tradable setup, and price inside or near a thin cloud is one of the weaker contexts to be trading from. Waiting for the cloud to thicken and for price to clear one side of it decisively is generally a better approach than trading through a thin section.
Using it in isolation without any price-action or volume confirmation. Like most single indicators, the Ichimoku Cloud performs best combined with other evidence rather than trusted entirely on its own, a TK cross that also lines up with a chart pattern's key level or a clear volume increase carries more weight than the cross by itself.
Ignoring the default settings without understanding why they matter. The standard 9/26/52 periods behind the Tenkan-sen, Kijun-sen, and Senkou Span B were originally built around a six-day trading week, which is part of why some traders adjust them for markets that trade on different schedules, crypto included, where price moves continuously. Changing the settings without understanding what they represent tends to produce a cloud that no longer corresponds to the standard interpretation most educational material and other traders are using.
FAQ: Ichimoku Cloud Questions Answered
Is the Ichimoku Cloud good for beginners?
It's more involved than a single moving average, but it's not unreasonably difficult for a beginner willing to learn the five components one at a time rather than all at once. Most of the initial intimidation comes from seeing all five lines plotted together immediately, which is why understanding each one's individual job: trend, momentum, and confirmation, tends to make the full indicator click much faster than trying to memorize it as a single block.
What does it mean when price is inside the cloud?
Price trading inside the cloud generally signals a period without a clear trend, often consolidation, where buyers and sellers are roughly balanced and "trend" and "momentum" don't have a strong directional read to offer yet. Many traders treat this as a wait-and-see period rather than a signal to enter, since the cloud itself hasn't confirmed which direction price is more likely to break.
Does the Ichimoku Cloud work in crypto trading?
Yes, the indicator is asset-agnostic and is used regularly on crypto charts, where its combination of trend, momentum, and support/resistance in one view is popular given how quickly crypto markets can shift between trending and consolidating. Crypto's typically higher volatility can produce cloud twists and thin sections more frequently than in traditional markets, making the confirmation step even more important.
What's the difference between the Ichimoku Cloud and moving averages?
A single moving average shows one smoothed read of recent price and nothing else. The Ichimoku Cloud effectively layers several moving-average-like calculations, the Tenkan-sen, Kijun-sen, and the two Senkou Spans, on top of each other, then projects two of them forward to build a support/resistance zone, which is something a standard moving average doesn't do at all. The tradeoff is that the Ichimoku Cloud takes longer to read correctly than glancing at where price sits relative to a single moving average line.
Sources
1. Ichimoku Cloud — ChartSchool, StockCharts.com
2. The Man Behind the Lines: Goichi Hosoda — Signal Trading Group