Three peaks on a chart: a smaller one, a taller one, a smaller one again, might be the single most recognized shape in technical analysis, even among people who've never opened a trading platform. The head and shoulders pattern has been used to call trend reversals for the better part of a century, and it remains one of the most searched, most taught, and most argued-about setups in the field.
This guide covers what actually makes a head and shoulders pattern valid, not just three bumps that resemble one, how to structure the trade once the neckline breaks, and where traders most often get it wrong. If you're looking to trade the breakdown via stock CFDs on Ouinex once the setup confirms, this is the framework to build on first.
What Is a Head and Shoulders Pattern?
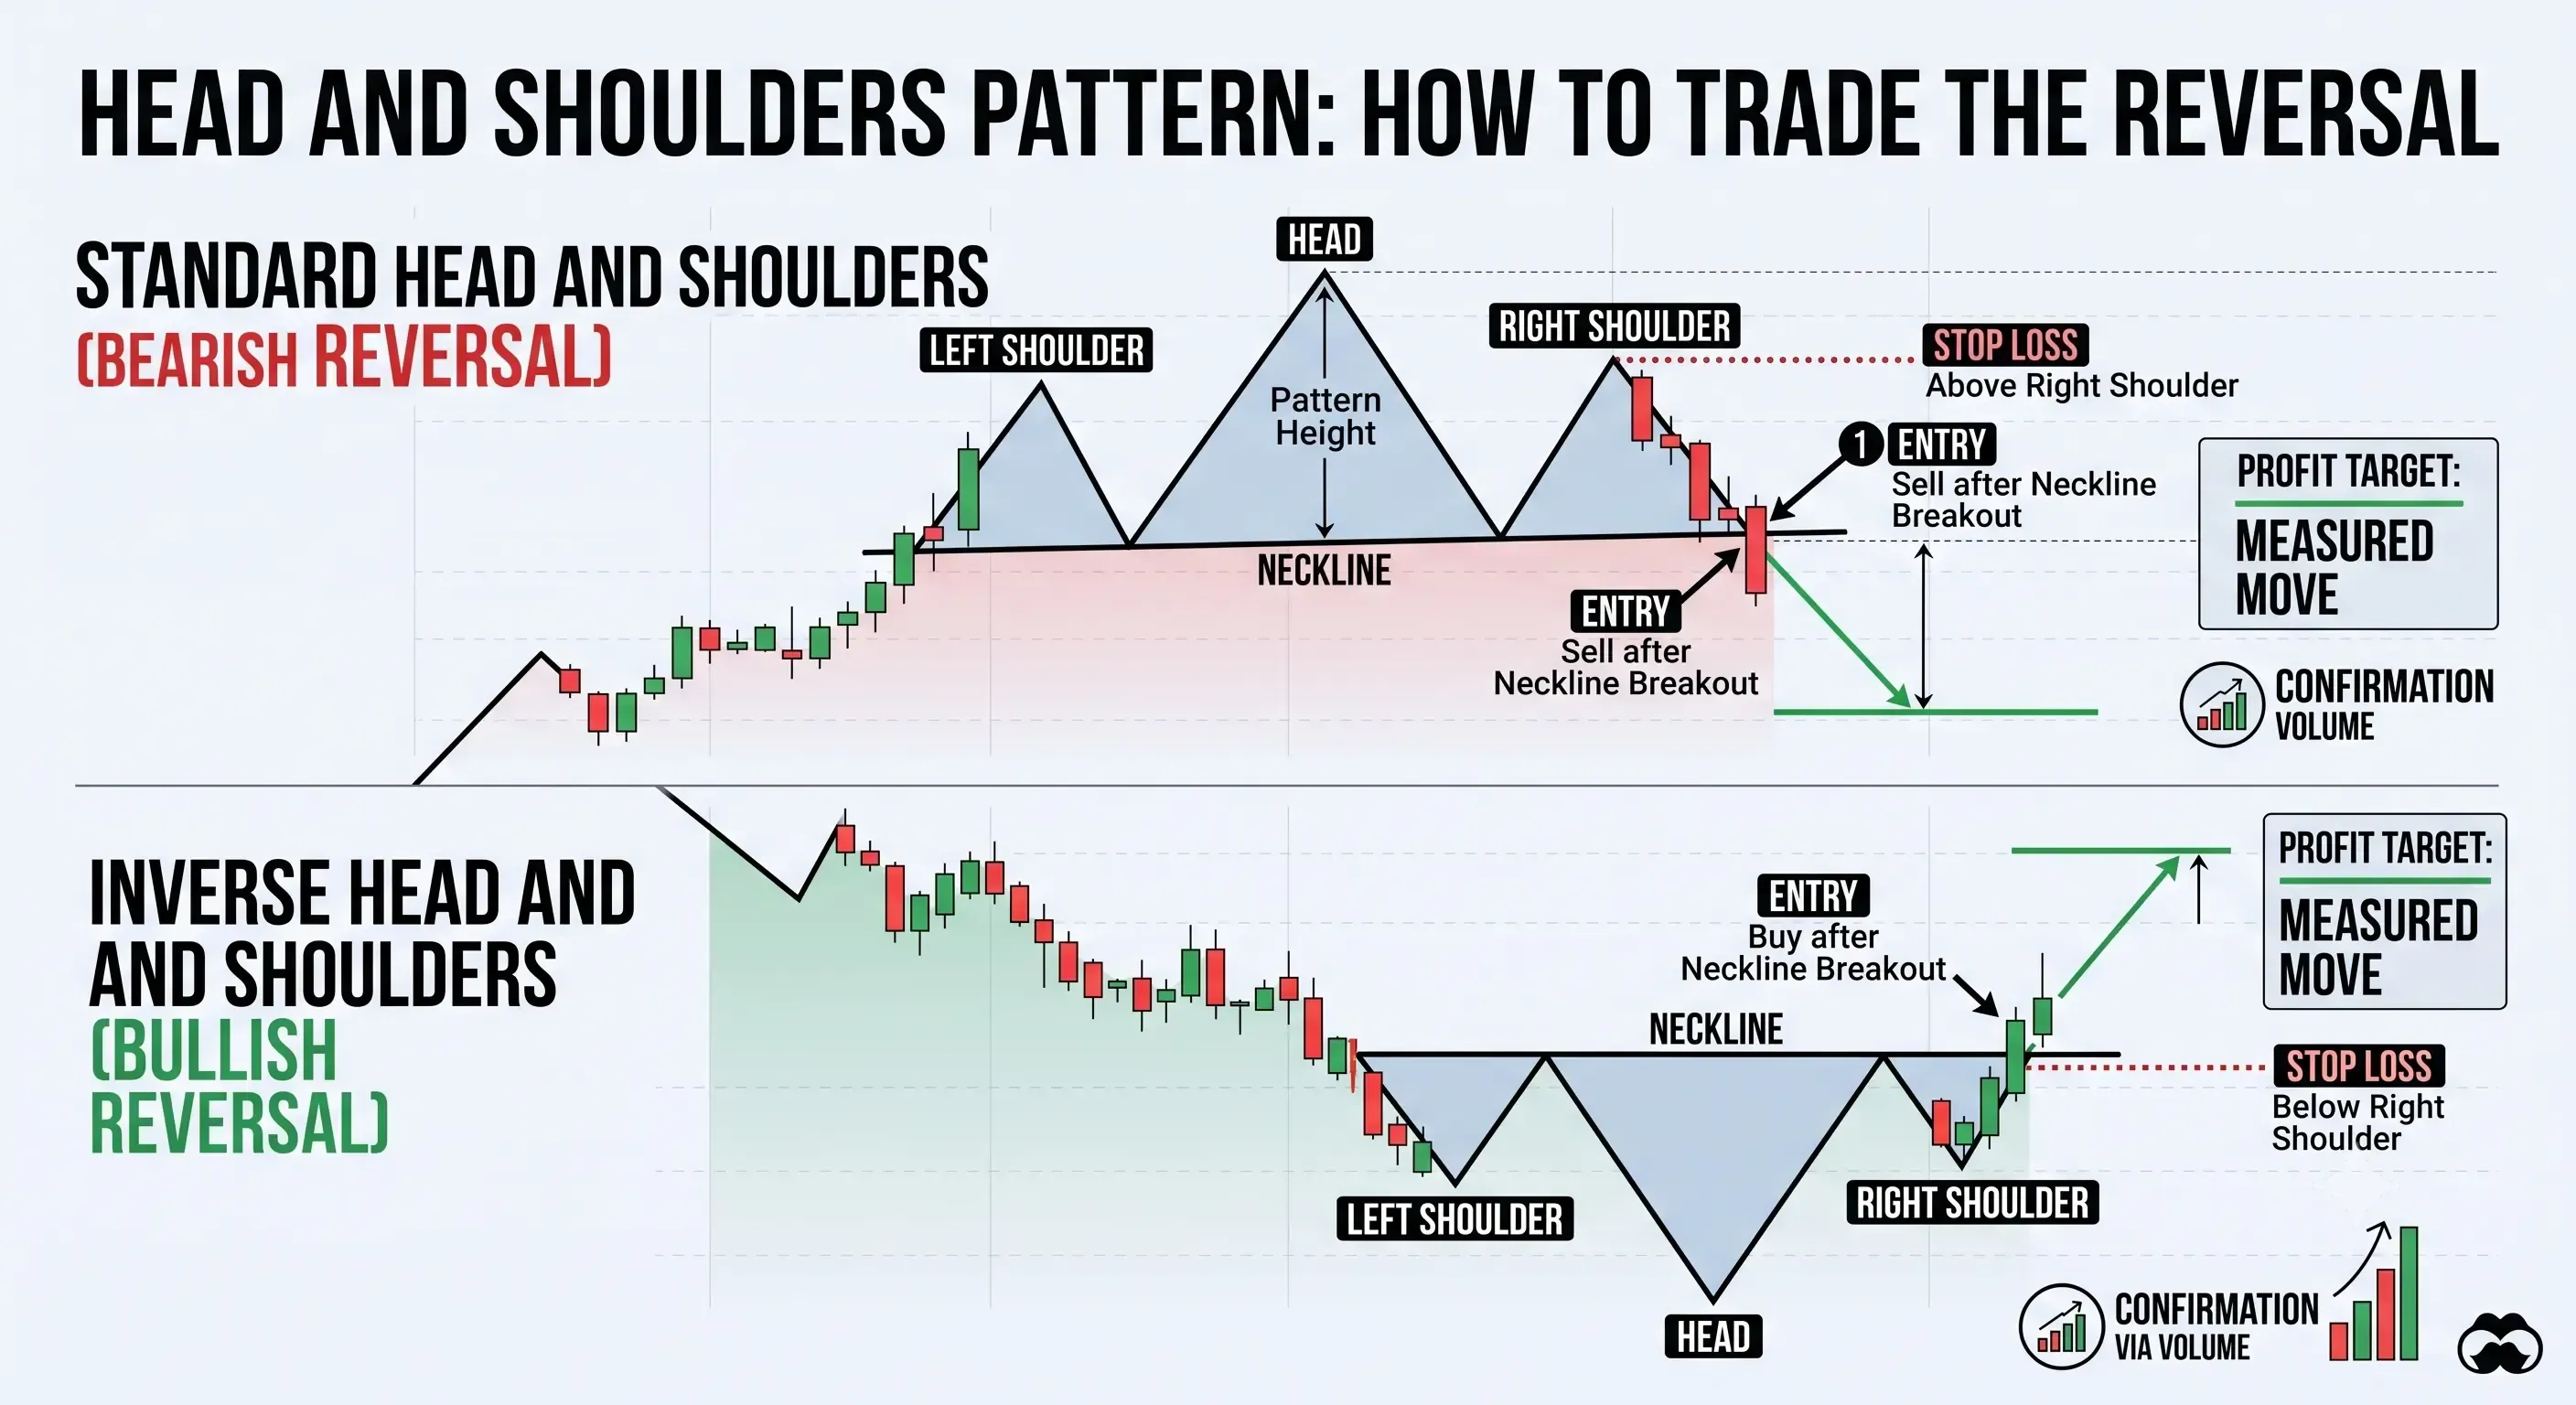
A head and shoulders pattern is a bearish reversal chart pattern made of three peaks: a left shoulder, a taller head, and a right shoulder, signalling that an uptrend is losing momentum and likely to reverse into a downtrend.
The pattern is one of the oldest documented setups in technical analysis, formalized by Robert Edwards and John Magee in their 1948 book *Technical Analysis of Stock Trends*, a text still treated as a foundational reference nearly eight decades later. Edwards and Magee described it as one of the more reliable reversal signals available to a chartist, and it has remained a standard part of technical analysis education ever since.
Unlike a continuation pattern such as the cup and handle, a head and shoulders pattern doesn't signal a pause before the trend resumes, it signals the trend is ending. That distinction matters for how you read it: spotting one in the middle of a strong uptrend isn't a reason to add to a long position, it's an early warning that the buyers who drove that uptrend are losing control.
How to Identify a Head and Shoulders Pattern
The pattern gets its name from its shape, and each of its components has a specific job in confirming the setup:
- Left shoulder. A peak forms as price rallies, then pulls back. On its own, this looks like an ordinary swing high, nothing about it signals a reversal yet.
- Head. A second rally pushes to a new, higher peak than the left shoulder, followed by a deeper pullback. The uptrend is still technically intact at this point, but the pullback that follows the head is often sharper than the one after the left shoulder, an early sign of weakening momentum.
- Right shoulder. A third rally fails to reach the head's high, forming a peak that roughly matches the left shoulder's height. The failure to make a new high here is what starts to separate this from an ordinary pullback within an uptrend.
- Neckline. The line connecting the two pullback lows, the trough between the left shoulder and the head, and the trough between the head and the right shoulder. This is the level that matters most: everything about the pattern stays provisional until price closes below it.
- Volume signature. Volume typically declines across the three peaks, with the head often showing weaker volume than the left shoulder despite the higher price, then increasing sharply on the neckline break. Declining volume into new highs is often one of the earliest tells that a head and shoulders pattern may be forming, well before the neckline itself is even tested.
If you want the fundamentals of how volume shows up at the candle level before applying it to a multi-week pattern like this one, Ouinex's candlestick and chart pattern basics is a useful place to start.
How to Trade a Head and Shoulders Breakdown
Once the three peaks and the neckline are in place, the trade itself comes down to the same three decisions as any other pattern: where to enter, where to invalidate, and where to target.
Entry. Wait for a confirmed close below the neckline rather than acting on an intraday break. Price often dips below a neckline and recovers back above it before the session closes, especially since the neckline is frequently a well-watched level that attracts buyers looking to fade an obvious breakdown
Stop-loss. Place your stop above the high of the right shoulder. That's the level at which the pattern's premise, that the right shoulder failed to make a new high, is invalidated; a move back above it means the "lower high" that defines the right shoulder no longer holds.
Price target. The standard measured-move target takes the vertical distance from the head's peak down to the neckline and projects that same distance below the breakdown point. As with any measured-move target, this is a planning reference rather than a promise, many traders use it to scale out of the position in stages rather than treating it as an automatic full exit.
Here's what most guides to this pattern leave out: the neckline retest that traders often treat as an optional bonus entry is actually the statistically normal path, not the exception. In technical analyst Thomas Bulkowski's large-sample study of head-and-shoulders tops, 68% of confirmed breakdowns pull back to retest the neckline before the decline continues, and his own data shows those pullbacks correlate with weaker post-breakout performance, not better. That complicates the confirmed-close entry rule above: a trader who enters immediately on the break should expect a retest more often than not, and a trader who waits specifically for that retest isn't waiting for a rare gift: they're waiting for the more common outcome, one that already comes with a performance discount attached. Investments can go up and down. Past performance is not necessarily indicative of future performance.
Example trade walkthrough. Say a stock forms a head and shoulders on the daily chart: the head peaks at $180 with the neckline sitting at $150, a $30 head-to-neckline distance, and the right shoulder forms just under $165 before rolling over. A confirmed daily close below $150 triggers entry, with the stop placed just above the right shoulder's $165 high. The measured-move target subtracts the $30 head-to-neckline distance from the $150 breakdown point, putting the initial target near $120, a level many traders would use to take partial profit rather than holding the full position for the entire move.
If terms like neckline or breakout aren't fully second nature yet, Ouinex's trading glossary is worth keeping open as a reference while you study this pattern. Because this is a leveraged CFD position, position size needs to account for the leverage in use, not just the dollar distance between entry and stop-loss: the same $150 breakdown carries very different risk at 5x leverage than it does at 50x.
CFD and leveraged trading amplifies both gains and losses, confirm the neckline break before entering, and always define your stop-loss.
What Is an Inverse Head and Shoulders Pattern?
The inverse head and shoulders is the bullish mirror image of the standard pattern, the same three-peak structure turned upside down, signalling a reversal from a downtrend into an uptrend rather than the other way around.
Instead of three peaks, it's built from three troughs: a left shoulder low, a deeper head low, and a right shoulder low that fails to reach the head's depth. The neckline here acts as resistance rather than support, connecting the two rally highs between the troughs, and a confirmed close above it is what completes the pattern. Every identification detail from the standard version, the volume signature, the role of the neckline, the requirement that the right shoulder fail to match the head, applies in reverse.
Common Mistakes When Trading This Pattern
A handful of habits account for most of the failed trades on this pattern.
Calling the pattern complete before the neckline actually breaks. Three peaks that look like a head and shoulders are not a trade signal on their own, the pattern isn't confirmed until price closes below the neckline. Traders who position for the reversal based on shape alone, before that close happens, are trading a prediction rather than a confirmed setup.
Ignoring volume confirmation. A neckline break on thin volume is one of the more common false signals in technical analysis, the level gets tested, price dips through it briefly, and then recovers because there wasn't enough real selling pressure behind the move. Waiting for volume to expand meaningfully on the break reduces how often this happens.
Sizing the position without accounting for leverage. The distance from entry to the stop above the right shoulder only defines the risk in price terms, combined with the leverage in use, it's what determines how large the position should actually be. Ouinex's guide to risk management covers this calculation in more detail, and it's worth applying to every leveraged breakdown trade, not just this pattern.
FAQ: Head and Shoulders Pattern Questions Answered
Is the head and shoulders pattern bullish or bearish?
The standard head and shoulders pattern is bearish, it signals that an uptrend is losing momentum and is likely to reverse into a downtrend once the neckline breaks. Its mirror image, the inverse head and shoulders, is bullish and signals the opposite: a reversal from a downtrend into an uptrend.
How reliable is the head and shoulders pattern?
No chart pattern is reliable in isolation, and the head and shoulders is no exception, its usefulness depends heavily on confirmation, particularly a genuine close below the neckline backed by rising volume. It's one of the most extensively studied reversal patterns, in part because it's been in continuous use since Edwards and Magee formalized it in 1948, but that long history is a reason it's well understood, not a guarantee it works every time it appears.
What's the difference between a head and shoulders pattern and a double top?
A double top is a simpler two-peak version of the same reversal logic, two roughly equal highs separated by a pullback, with confirmation coming on a close below that pullback's low. A head and shoulders adds a third peak and requires that middle peak, the head, to be higher than the two surrounding it, which is what gives the pattern its distinctive three-peak shape and, for many traders, a somewhat stronger reversal signal than a double top alone.
Does the head and shoulders pattern work on crypto charts?
Yes, the pattern is asset-agnostic and appears regularly on crypto charts, including on major perpetual contracts. Crypto's higher volatility can make the shoulders and head less symmetrical than the textbook version, so volume confirmation on the neckline break becomes an even more important filter than it is in traditional equity markets.
Sources