Fibonacci Retracement Trading Guide: Levels, Entries, and Targets
Updated October 2026
Every trader eventually notices the same thing: after a strong move, price rarely reverses at a random point. It tends to pull back to one of a handful of recurring levels before either continuing in the original direction or breaking down entirely. Fibonacci retracement is the tool most traders use to mark those levels in advance, rather than guessing where a pullback might stop.
This guide covers the five key retracement levels, how to draw and trade them, how retracement differs from its counterpart, Fibonacci extension, and the mistakes that turn a genuinely useful tool into a source of bad trades. If you want to trade gold and other commodities via CFDs on Ouinex once a retracement level lines up with your setup, the framework below is where that decision gets made.
What Is Fibonacci Retracement?
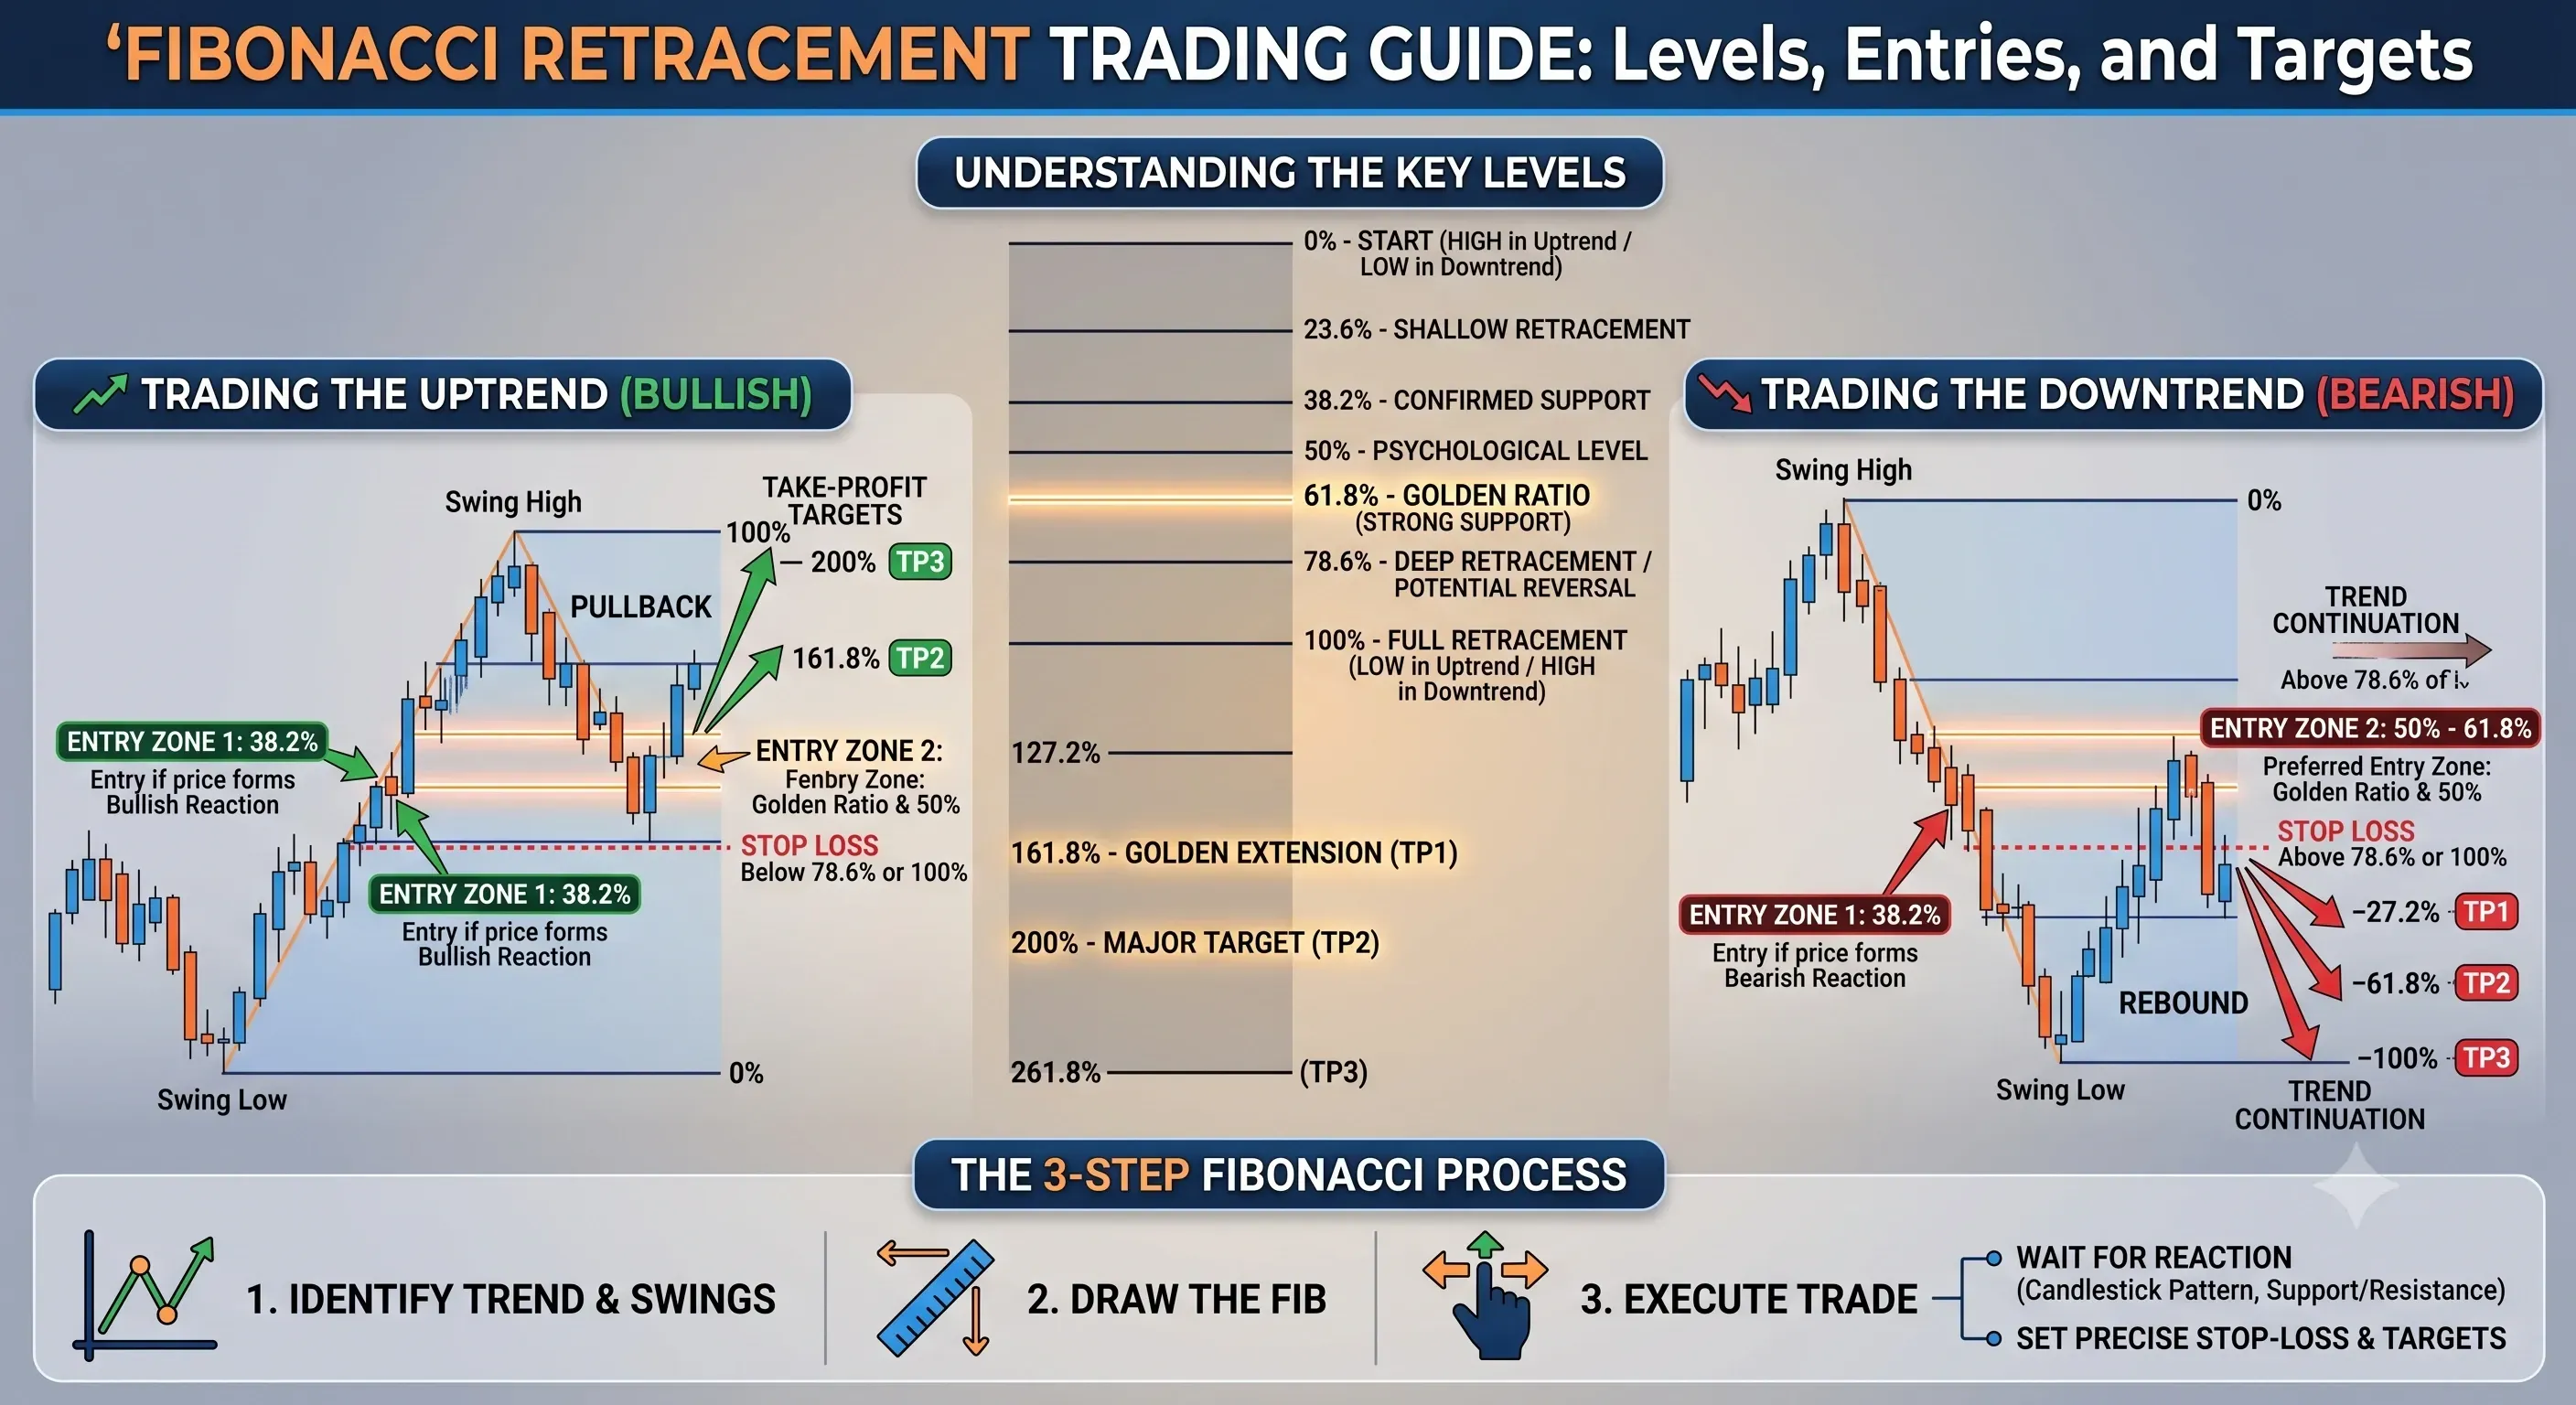
Fibonacci retracement is a technical analysis tool that uses horizontal lines at key percentages, 23.6%, 38.2%, 50%, 61.8%, and 78.6%, to identify where a price pullback is likely to find support or resistance.
The percentages come from the Fibonacci sequence, a number sequence described by the Italian mathematician Leonardo Fibonacci in the 13th century, in which each number is the sum of the two before it (0, 1, 1, 2, 3, 5, 8, 13, 21, and so on). Dividing certain numbers in that sequence by others produces a small set of recurring ratios, most famously 0.618, known as the golden ratio, which shows up repeatedly in nature, art, and architecture long before anyone applied it to a price chart. Technical analysts later adapted those ratios into the retracement tool used today, on the theory that markets, like a lot of naturally occurring growth patterns, tend to expand and contract in proportions related to those same ratios.
The core idea is simple even if the math behind it isn't: after a significant move up or down, price tends to retrace a predictable portion of that move before continuing in the original direction. Fibonacci retracement levels mark the zones where that pause is statistically more likely to happen, giving traders a set of levels to watch rather than a single guess.
The Key Fibonacci Retracement Levels
Five percentages make up the standard retracement tool, and most charting platforms plot all five automatically once you draw the tool across a move. Each one marks a zone where price has historically found support and resistance during a pullback, though how strong that zone turns out to be depends heavily on confluence, covered below.
- 23.6%: a shallow retracement, often seen in strong trends where the pullback barely interrupts the move before it continues.
- 38.2%: a moderate retracement, one of the more commonly watched levels for continuation trades.
- 50%: not a true Fibonacci ratio at all, it doesn't come from the sequence's mathematics the way the other four levels do, but it's included by convention because markets retrace almost exactly half of a move often enough that traders kept it on the tool. This is one of the more common points of confusion for traders new to the tool, since it looks like it belongs mathematically but doesn't.
- 61.8%: the "golden ratio" level, derived directly from dividing a number in the Fibonacci sequence by the one immediately after it. Widely considered the most closely watched retracement level.
- 78.6%, a deep retracement; a pullback this large is sometimes read as a sign the original move is at greater risk of failing rather than simply pausing.
Worth stating plainly: the 50% level working about as often in practice as the mathematically "real" levels around it is itself a clue about why this tool works at all. If price genuinely respected these zones purely because of some hidden mathematical property of markets, a level with no basis in the Fibonacci sequence shouldn't perform comparably to one that does, but it does. The more grounded explanation is that these levels function partly as a self-fulfilling mechanism: enough traders are watching and reacting to the same handful of percentages that the crowd's behavior at those levels becomes part of what makes them hold, independent of whatever mathematical elegance first inspired the tool. That's not a knock on Fibonacci retracement, a crowd-driven signal that plays out consistently enough to trade around is still genuinely useful, but it's a different, more honest mechanism than the golden-ratio-in-nature story usually implies, and it's also why the tool tends to work better on widely charted, heavily traded instruments than on obscure ones few other traders are watching.
How to Use Fibonacci Retracement in a Trade
Applying the tool correctly starts with drawing it in the right direction, then treating each level as a zone to watch rather than a line to trust blindly.
To draw the tool, click on the swing low and drag to the swing high for an uptrend, or the reverse, swing high to swing low, for a downtrend. Getting this direction backward is one of the most common technical mistakes traders make with the tool, since it produces levels that don't correspond to anything the price is actually doing.
Picking the right swing points matters as much as picking the right direction. The tool should be drawn across a clean, well-defined move, a genuine swing low to a genuine swing high, not an arbitrary recent candle. On a choppy or sideways chart, there often isn't a clear enough move to draw the tool against in the first place, which is part of why Fibonacci retracement tends to be more useful in trending markets than range-bound ones. Timeframe matters too: the same asset can show a valid-looking retracement on a 15-minute chart and a completely different one on a daily chart, so the timeframe used to draw the tool should match the timeframe the trade is actually being planned on.
The single most useful concept once the levels are drawn is confluence: a Fibonacci level lining up with an existing support or resistance zone, a trendline, or a chart pattern's key level is a meaningfully stronger signal than the Fibonacci level on its own. A 61.8% retracement that happens to land exactly on a prior swing high, for example, carries more weight than a 61.8% level sitting in open space with nothing else nearby. Fibonacci retracement is rarely used as a standalone signal for this reason, it's most effective layered on top of the chart patterns cheat sheet's reversal and continuation setups, where a retracement level confirming a pattern's key level is one of the more reliable combined signals in technical analysis.
Example trade walkthrough (gold CFD). Say gold rallies from $1,950 to $2,150, a $200 move. Drawing the retracement tool from the $1,950 swing low to the $2,150 swing high plots the five levels within that range: 23.6% at roughly $2,103, 38.2% at $2,073, 50% at $2,050, 61.8% at $2,026, and 78.6% at $1,993. If price pulls back and finds support at the 61.8% level ($2,026) and that level also happens to sit close to a prior consolidation zone from before the rally, genuine confluence, a trader might look for a bullish reversal signal there as an entry, with a stop-loss placed just below the level and a target back toward the $2,150 high or beyond.
Trading a retracement with leverage magnifies both gains and losses, a Fibonacci level is a probability zone, not a guarantee, so always define your stop-loss.
Fibonacci Retracement vs Fibonacci Extension
Fibonacci retracement finds likely pullback and entry zones within a move that's already happened, while Fibonacci extension projects likely profit targets beyond that original move.
Where retracement levels sit between the swing low and swing high you've drawn, extension levels project outward past the swing high (in an uptrend) using the same underlying ratios, most commonly 127.2% and 161.8%. Traders typically use retracement to plan the entry and extension to plan where to take profit, which means the two tools are usually drawn on the same move and used together rather than as alternatives to each other.
Using the same gold example from above, a $1,950 to $2,150 rally, the 127.2% extension projects to roughly $2,204, and the 161.8% extension projects to roughly $2,274. A trader who entered near the 61.8% retracement level at $2,026 might use those extension levels as reference points for scaling out of the position on the way back up, rather than picking an arbitrary exit with no technical basis behind it.
Common Mistakes When Trading Fibonacci Levels
The tool is simple to plot, which is part of why it's also easy to misuse.
Treating every level as guaranteed support or resistance. A Fibonacci level has historically acted as a zone where price often pauses or reverses, it doesn't guarantee that outcome on any individual trade, and treating it as a hard floor or ceiling leads to oversized positions and poorly placed stops.
Ignoring confluence and trading the level in isolation. A retracement level with nothing else backing it up, no prior support, no trendline, no pattern, is a considerably weaker signal than one that lines up with other technical evidence. Traders who plot Fibonacci levels and trade the first touch, regardless of what else is happening on the chart, tend to get chopped up by the levels that don't hold.
Not defining a stop-loss because "the level should hold." This is less a technical mistake than a risk-management one, but it's common enough with this specific tool to call out separately. A Fibonacci level failing to hold isn't a rare edge case, it's a routine outcome, and Ouinex's guide to risk management covers how to size a position and set a stop before that happens rather than after.
Redrawing the tool constantly to force a level onto a level. It's tempting to nudge the swing points slightly until a Fibonacci level lines up perfectly with where price actually turned, but that's working backward from the outcome rather than trading the tool forward. The swing points should be chosen based on the clearest, most obvious high and low on the chart, decided before price reaches the levels, not adjusted afterward to manufacture a better-looking chart.
FAQ: Fibonacci Retracement Questions Answered
What is the most important Fibonacci retracement level?
The 61.8% level, known as the golden ratio, is generally considered the most closely watched of the five, it's the level most directly derived from the Fibonacci sequence's core ratio and the one traders most often treat as a final line of defense for a pullback before a trend is considered at risk. That said, "most important" is relative to context: a level backed by confluence with other technical evidence is more significant than any single percentage in isolation.
Does Fibonacci retracement work in crypto trading?
Yes, the tool is asset-agnostic and is widely used on crypto charts, arguably even more so than in traditional markets given how frequently crypto produces the kind of sharp, clean swings the tool is drawn from. Crypto's higher volatility can make price move through multiple levels quickly, so combining retracement with confluence and a clearly defined stop-loss matters even more than usual.
What's the difference between Fibonacci retracement and Fibonacci extension?
Retracement measures likely pullback zones within a move that has already happened, using levels like 38.2% and 61.8% that sit inside the original swing. Extension projects likely target zones beyond that move, using levels like 127.2% and 161.8% that sit outside the original swing. They're typically used together, retracement for the entry, extension for the target, rather than as competing tools.
Is Fibonacci retracement reliable on its own?
Not especially, like most single indicators, Fibonacci retracement performs best as one input among several rather than a standalone signal. A level with confluence from a chart pattern, a prior support or resistance zone, or a trendline is considerably more reliable than the same percentage with nothing else backing it up.
Sources