
Two peaks at roughly the same price, with a pullback in between, is one of the simplest shapes in technical analysis to spot, and one of the easiest to call too early. The double top pattern shows up constantly across every market and timeframe, but the gap between "I see two peaks" and "I have a confirmed, tradable double top" is where most of the mistakes on this pattern actually happen.
This guide covers how to identify a valid double top, how to structure the trade once the breakdown is confirmed, its bullish mirror image (the double bottom), and where traders most often jump the gun. If you want to trade the breakdown via commodity CFDs on Ouinex once the setup confirms, this is the framework to build on first. For how this pattern fits alongside the rest of the major setups, see the full chart patterns cheat sheet.
What Is a Double Top Pattern?
A double top pattern is a bearish reversal chart pattern formed by two peaks at roughly the same price, separated by a pullback, that signals an uptrend is losing momentum and likely to reverse into a downtrend.
Like the head and shoulders, it's one of the classical reversal patterns formalized by Robert Edwards and John Magee in their 1948 book *Technical Analysis of Stock Trends*, a simpler, two-peak version of the same reversal logic. Where a head and shoulders needs three distinct peaks with the middle one higher, a double top only needs two peaks that fail to make meaningful further progress, which is part of why it's one of the more frequently spotted reversal shapes across any chart.
The pattern is a reversal pattern, not a continuation one, it marks a shift from an uptrend to a downtrend, the same category as the head and shoulders and the opposite category from a continuation setup like the cup and handle. It typically forms after a sustained uptrend, at the point where buyers make one more attempt at a new high, fail, and start giving way to sellers.
How to Identify a Double Top Pattern
Not every pair of peaks qualifies. Four structural details separate a valid double top from a shape that merely looks similar:
- Peak price variation: under 3%. The two peaks should top out at roughly the same price, Bulkowski's identification guidelines put the acceptable variation at under 3% between the two highs. Peaks that differ by more than that start to look less like a genuine double top and more like an uneven, unrelated pair of highs.
- Pullback depth: at least 10%. The decline between the two peaks, the valley, should measure at least 10% from the first peak's high. A shallower pullback doesn't give the pattern enough structure to be meaningful, and tends to produce weaker, less reliable setups
- Prior trend: a genuine, sustained uptrend. A double top that forms after a long, clear climb is considered far more reliable than one that forms after a brief or shallow rise, the pattern needs an established uptrend to actually reverse. Without that context, two peaks are just two peaks, not a reversal signal.
- Volume signature: higher on the first peak, declining into the second. Volume is usually higher on the formation of the first peak than the second, and trends downward across the pattern. A second peak on visibly lower volume than the first is a sign buying interest is fading even as price makes one more run at the highs.
If you're still building a foundation in reading price structure, candlestick and chart pattern basics is a useful starting point before relying on any single reversal pattern.
How to Trade a Double Top Breakdown
Once both peaks and the valley between them are in place, the trade comes down to the same three decisions as any other pattern.
Entry. Wait for a confirmed close below the valley low, the pullback between the two peaks, rather than acting on an intraday dip through it. This is the single most important rule on this pattern, and the data backs it up unusually clearly: unconfirmed "twin peaks" fail to turn into a real decline roughly 60% of the time, meaning price continues higher instead of dropping. Patterns that actually get a confirmed close below the valley fail far less often, closer to 25%. That gap between an unconfirmed shape and a confirmed one is the entire game with this pattern.
Stop-loss. Place your stop a little above the higher of the two peaks. If price reclaims that level after a confirmed breakdown, the pattern has failed and the reversal thesis no longer holds.
Price target. The standard measured-move target takes the vertical distance from the higher peak down to the valley low, and projects that same distance below the breakdown point. This is a planning reference, not a promise of where price will land, many traders use it to take partial profit or move a stop to breakeven rather than as an automatic full exit. Investments can go up and down. Past performance is not necessarily indicative of future performance.
Example trade walkthrough (commodity CFD). Say gold forms a double top on the daily chart: the first peak tops out at $2,450, pulls back to a valley low of $2,180 (an 11% pullback), then rallies to a second peak at $2,460, a 0.4% variation from the first peak, comfortably inside the under-3% guideline. A confirmed daily close below $2,180 triggers the entry, with the stop placed just above the $2,460 second-peak high. The measured-move target subtracts the $280 peak-to-valley distance from the $2,180 breakdown point, putting the initial target near $1,900.
Because this trade is executed via commodity CFDs, position size should account for the leverage in use, not just the dollar distance between entry and stop-loss. Ouinex's trading glossary is worth keeping open alongside any chart you're studying if terms like "breakdown" or "support" aren't fully familiar yet.
CFD and leveraged trading amplifies both gains and losses, confirm the breakdown before entering, and always define your stop-loss.
What Is a Double Bottom Pattern?
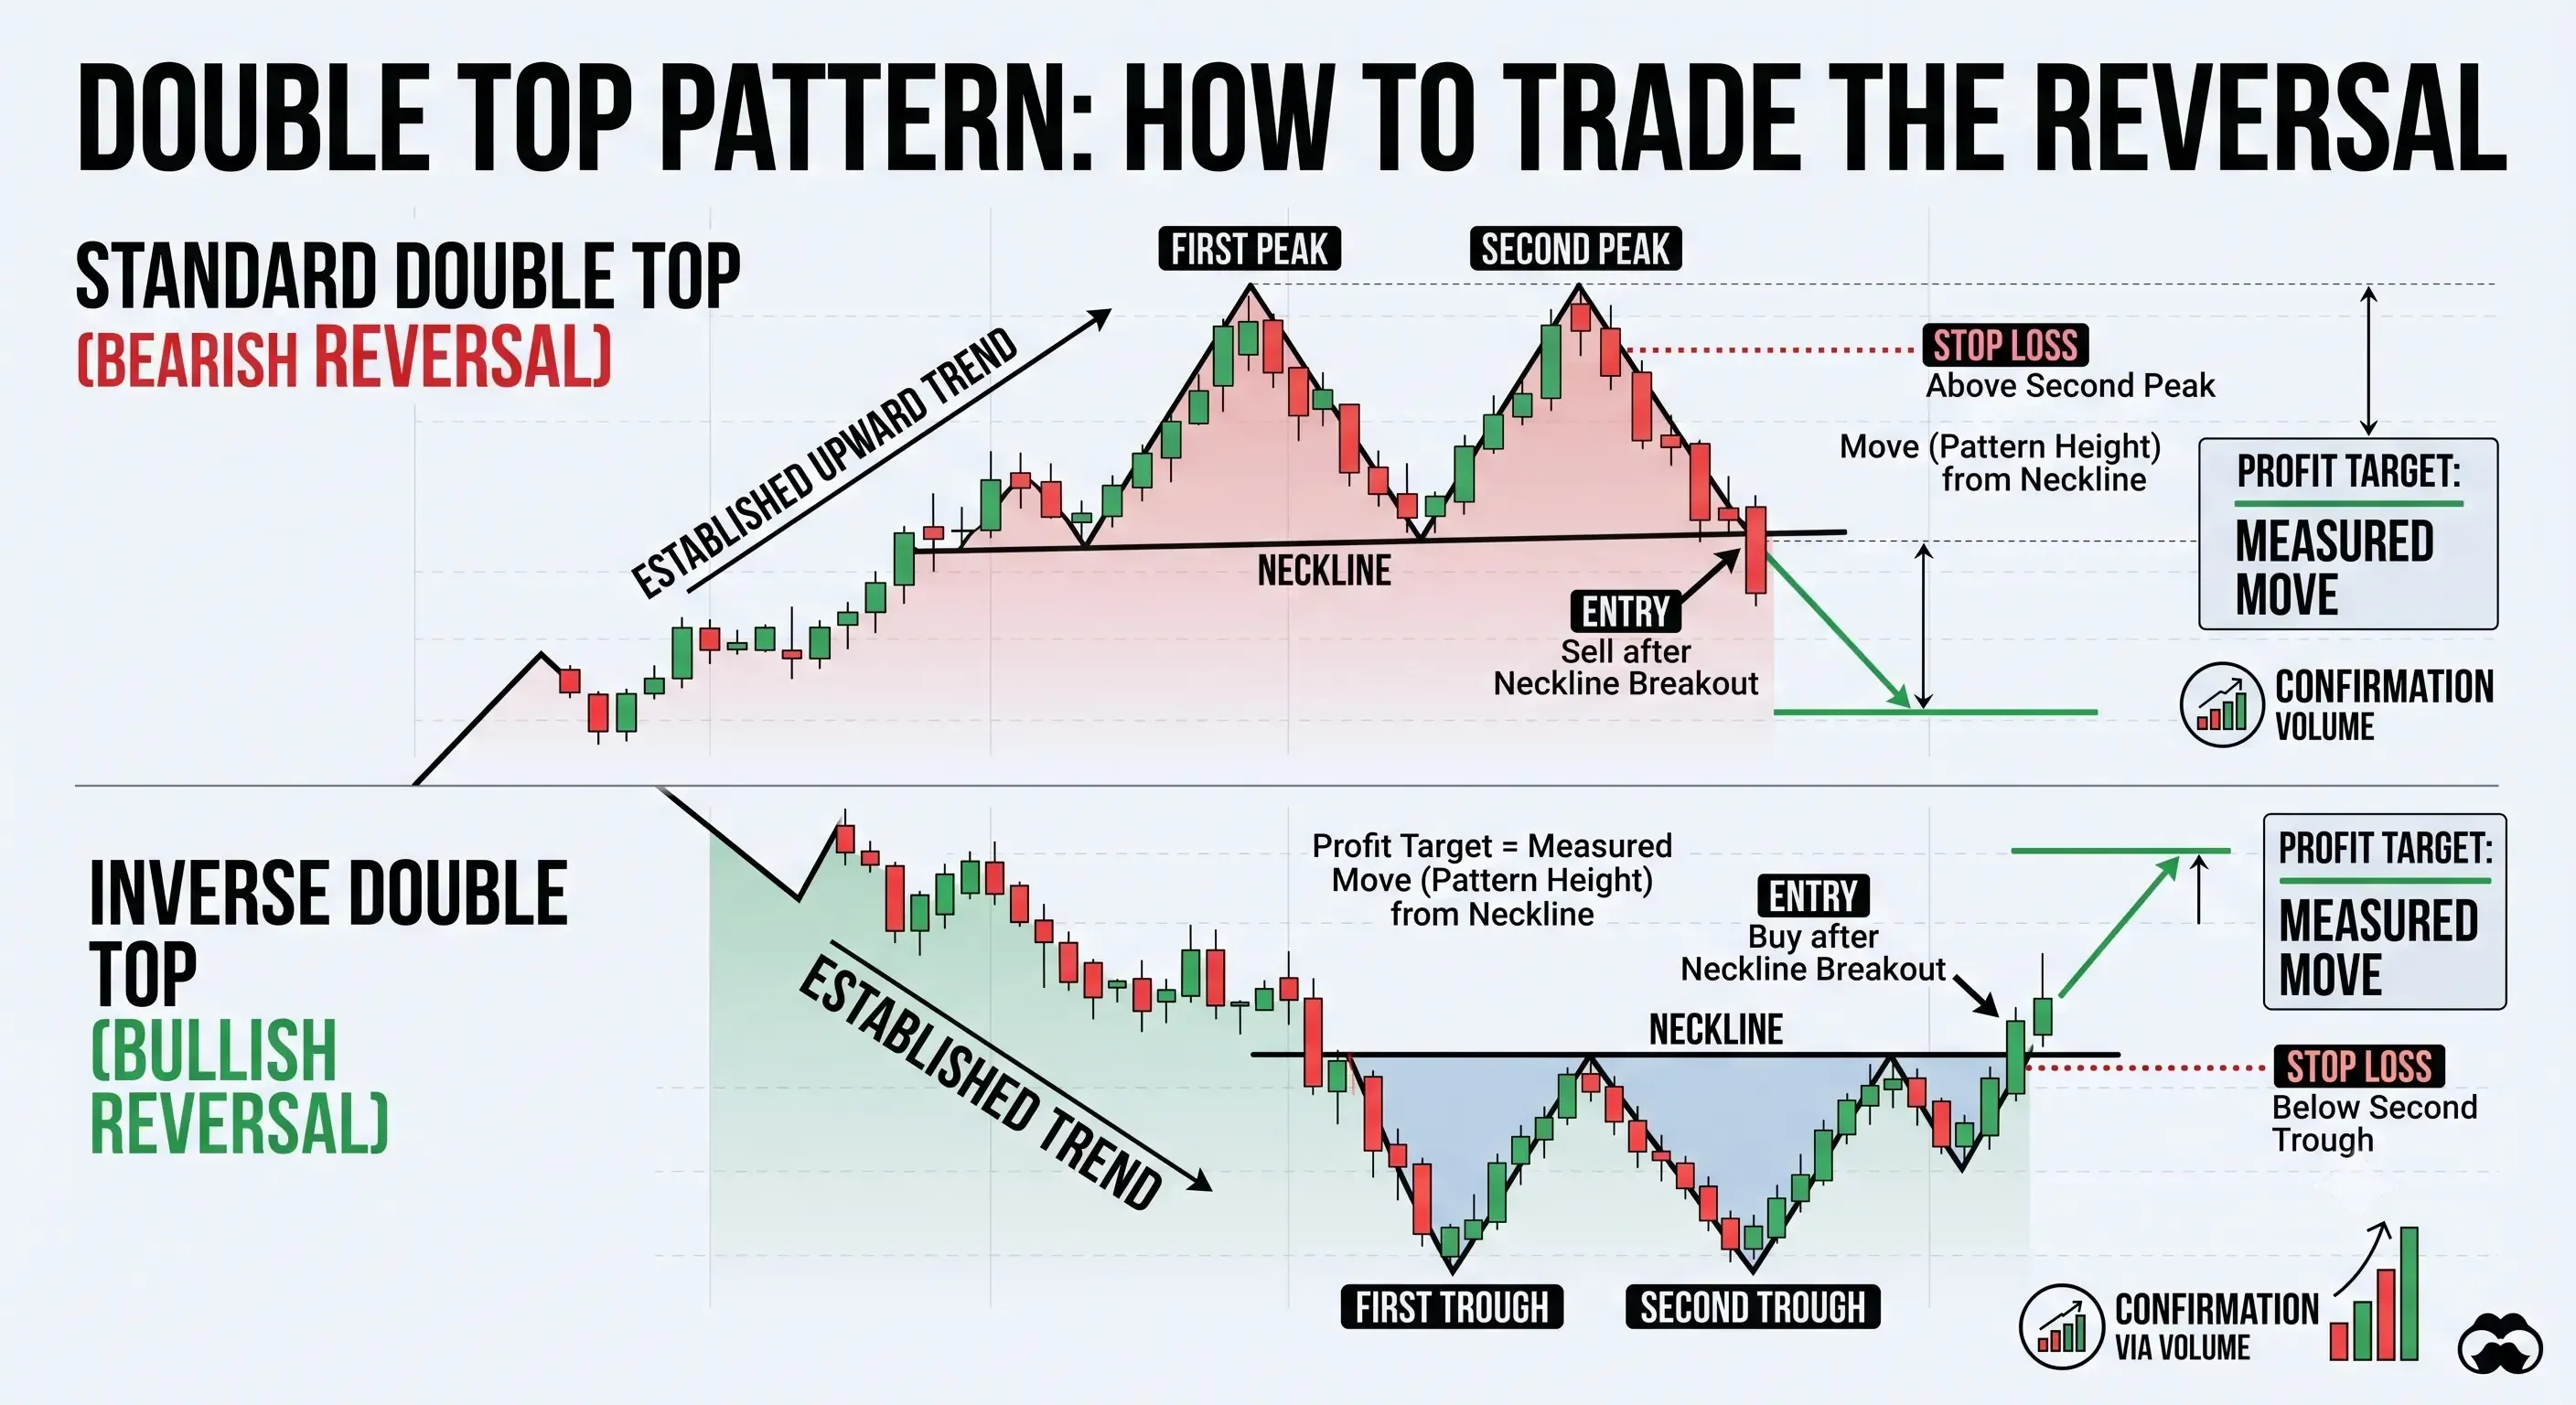
A double bottom pattern is the bullish mirror image of the double top, two troughs at roughly the same price, separated by a bounce, signalling a reversal from a downtrend into an uptrend.
The structure is identical, just upside down: a first low, a bounce, then a second low that holds at roughly the same level as the first (again, generally within about 3%) before price closes above the bounce high in between. That bounce high acts as resistance rather than support, and a confirmed close above it is what completes the pattern. All of the same guidelines apply in reverse, the trough variation, the bounce depth, the need for a genuine prior downtrend, and volume that ideally picks up on the breakout above the bounce high.
Common Mistakes When Trading This Pattern
Even on a pattern this simple, a handful of habits account for most of the failed trades.
Calling the pattern complete after the second peak forms, before the valley actually breaks. Two peaks at a similar price are not yet a confirmed double top, as the data above shows, most unconfirmed twin-peak shapes never turn into a real decline at all. Trading the shape before the close below the valley is trading a guess, not a confirmed setup.
Being too strict about the exact peak variation. Insisting the two peaks match to the decimal causes traders to dismiss otherwise valid patterns over trivial differences. The 3% guideline is a reasonable filter, not a hard law, a pattern at 3.2% variation with everything else intact usually still deserves attention.
Ignoring volume confirmation on the breakdown. A close below the valley on thin volume is a weaker signal than one accompanied by a clear volume increase, and is more prone to reversing shortly after.
Sizing the position without accounting for leverage. The distance from entry to the stop above the second peak only defines the risk in price terms, combined with the leverage in use, it's what actually determines how large the position should be. Ouinex's guide to risk management covers this calculation in more detail.
FAQ: Double Top and Double Bottom Pattern Questions Answered
Is the double top pattern bullish or bearish?
The double top pattern is bearish, it signals that an uptrend is losing momentum and is likely to reverse into a downtrend once the valley breaks. Its mirror image, the double bottom, is bullish and signals the opposite: a reversal from a downtrend into an uptrend.
How reliable is the double top pattern?
Reliability depends almost entirely on confirmation. Unconfirmed twin-peak shapes fail to turn into a genuine decline roughly 60% of the time, while patterns that get an actual confirmed close below the valley fail closer to 25% of the time. That's a large enough gap that the confirmation rule isn't optional technique, it's the difference between a coin-flip setup and a workable one.
What's the difference between a double top and a head and shoulders?
A double top has two peaks at a similar price with one pullback between them. A head and shoulders has three peaks, with the middle one (the head) distinctly higher than the two surrounding shoulders. Both are reversal patterns confirmed by a break of the support level connecting the pullback lows, but the head and shoulders' extra peak is generally considered a somewhat stronger reversal signal than the simpler double top.
Does the double top pattern work in crypto trading?
Yes, the pattern is asset-agnostic and appears regularly on crypto charts. Crypto's typically higher volatility can push the peak-to-peak variation and pullback depth toward the wider end of the usual ranges, so volume confirmation on the breakdown becomes an especially important filter in crypto specifically.
Sources
1. Double Top (Reversal) — ChartSchool, StockCharts.com
2. Bulkowski on Adam & Adam Double Tops — ThePatternSite.com