A chart shaped like a coffee cup isn't the kind of thing you'd expect to move markets. But the cup and handle pattern is one of the most consistently referenced continuation setups in technical analysis, showing up on everything from decades-old blue-chip stock charts to Bitcoin's four-hour candles. Once you know what to look for, spotting one is straightforward: the harder part is trading it with discipline once you do.
This guide covers how to identify a valid cup and handle pattern, how to structure the trade once the breakout is confirmed, and where most traders get it wrong. If you want to trade the breakout via crypto perpetuals on Ouinex once you've spotted the setup, this is the framework to build on first.
What Is a Cup and Handle Pattern?
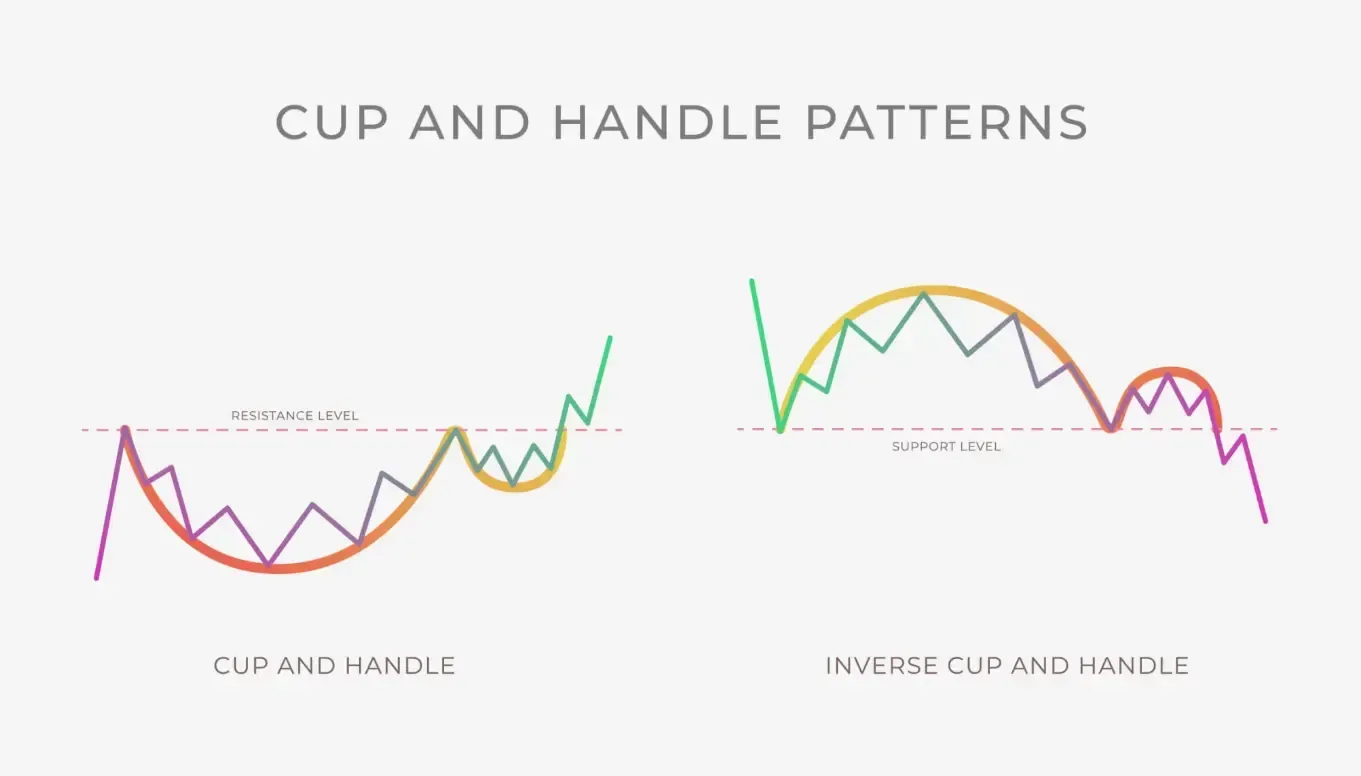
A cup and handle pattern is a bullish continuation shape: a rounded U (the cup) followed by a short downward-drifting pullback (the handle), signalling a likely resumption of the uptrend once price breaks the handle's resistance.
The setup was coined by legendary stock trader William O'Neil in his 1988 book How to Make Money in Stocks, where his study of the market's best-performing stocks going back to the 1950s identified it as one of the more reliable bases from which growth stocks launch their next leg higher. O'Neil's original research was built on decades of historical stock charts, but the pattern generalizes well: the same buyer-seller dynamics that produce it in equities show up in crypto and forex charts too.
Visually, the cup resembles the rounded bottom of a "U," not a sharp "V", and that rounding matters, because it reflects a gradual shift from selling pressure to accumulation rather than a single panic-driven flush. The handle that follows is a shallow pullback that shakes out short-term holders before the breakout. Because the pattern forms after an existing uptrend and typically resolves in the same direction, it's classified as a continuation pattern, not a reversal one: it doesn't call an end to the prior trend, it signals a pause before that trend resumes.
How to Identify a Valid Cup and Handle Pattern
Not every rounded dip qualifies. Four structural details separate a valid cup and handle from a shape that merely looks similar:
- Cup depth: 12–33% retracement. The cup typically retraces between 12% and 33% off the prior high before basing and turning back up. Shallower cups, closer to 12%, tend to appear in strong uptrends with light selling; deeper cups, closer to 33%, usually reflect more sustained profit-taking before buyers regain control. A retracement much beyond 33% starts to look less like a healthy pause and more like a genuine trend change.
- Cup shape: rounded "U," not a sharp "V." A valid cup takes time to form and rounds out gradually at the base, that gradual curve is what signals sellers are being exhausted rather than panicking. A sharp V-shaped dip that snaps straight back up is a weaker, less reliable version of the setup, since it hasn't given the market time to genuinely absorb supply.
- Handle: 10–15% pullback, on lower volume. After the cup completes its right side, price should pull back modestly, typically 10% to 15% off the cup's high, before consolidating. The handle ideally slopes down or sideways rather than sharply reversing, and it should form on noticeably lower volume than the cup itself. For the fundamentals of how volume and price interact at a candle level, Ouinex's candlestick and chart pattern basics is a useful companion read here.
- Volume signature: declining, then drying up, then spiking. Volume should decline as the cup forms, drop off further during the handle, and then expand sharply on the breakout candle. That spike is what confirms genuine buying interest is driving the move, rather than a low-volume drift that could reverse just as easily.
How to Trade the Cup and Handle Breakout
Once the pattern checks out structurally, the trade itself comes down to three decisions: where to enter, where to invalidate, and where to take profit.
Entry. Wait for a confirmed close above the handle's resistance: the high point of the handle, rather than acting on an intraday wick through it. Price frequently pokes above a level and snaps back before the session closes; a confirmed-close rule filters that out.
Stop-loss. Place your stop below the low of the handle. That's the pattern's natural invalidation point, if price falls back through it, the setup has failed, and holding on past that level usually means giving back more than the trade was worth risking.
Price target. The standard measured-move target takes the cup's depth (from its low to the breakout point) and projects that same distance upward from the breakout. This is a planning reference, not a promise of where price will land: many traders use it to take partial profit or move their stop to breakeven rather than as an automatic full exit.
Most guides to this pattern stop there, and that's worth flagging: the measured-move target isn't backed by any guarantee baked into the cup's shape. In technical analyst Thomas Bulkowski's large-sample study of 913 bull-market cup and handle trades, only 5% failed to move at least 5% past the breakout, but just 61% of patterns actually reached the full measured-move target, and 47% saw a substantial pullback within two months of breaking out. Waiting for a confirmed close, the entry rule above, is what keeps a trader on the right side of the gap between "the breakout held" and "the target got hit." The measured-move target describes where the pattern points, not an outcome it owes you. Investments can go up and down. Past performance is not necessarily indicative of future performance.
Example trade walkthrough. Say ETH/USD forms a cup on the four-hour chart, topping at $3,200 before basing at $2,700: a 15.6% retracement, comfortably inside the 12–33% range. The right side of the cup recovers back toward $3,180, where the handle forms: a shallow pullback to roughly $2,800, about 12% off the handle's own high, on visibly lighter volume than the cup itself. A confirmed four-hour close above $3,180 triggers the entry. The stop-loss sits just below the handle's low, around $2,780. The measured-move target adds the cup's $500 depth to the $3,180 breakout point, putting the first target near $3,680, a level where many traders would take partial profit or shift their stop to breakeven rather than holding for the full move.
Because this trade is executed via crypto perpetuals, position size should account for the leverage in use, not just the dollar distance between entry and stop-loss. If you're unclear on how leverage works, it's worth reviewing before sizing this or any breakout trade.
It's also worth watching for confluence around the breakout level, a prior resistance zone, a round number, or a moving average sitting near the handle's high all add weight to the setup. None of these guarantee the breakout holds, but a level with multiple reasons to matter tends to attract more genuine volume than one with none.
CFD and perpetual trading involves leverage, which magnifies both gains and losses: define your stop-loss before entering any breakout trade.
Is the Cup and Handle Pattern Bullish or Bearish?
The standard cup and handle pattern is bullish: it's a continuation setup that signals an existing uptrend is likely to resume once the handle resolves higher. It doesn't appear at market bottoms calling for a reversal; it appears mid-trend, after an uptrend is already established, as a pause before the next leg up.
There is a bearish mirror image: the inverse cup and handle. It's the same structure turned upside down: a rounded, inverted "U" top followed by a short upward-drifting handle, and it typically appears within a downtrend, signalling the decline is likely to resume once price breaks below the handle's support. The identification rules mirror the bullish version almost exactly: comparable retracement ranges, comparable handle depth, and the same expectation that volume should expand on the breakdown rather than the breakout.
Common Mistakes When Trading the Cup and Handle Pattern
Even once you know the rules, a handful of mistakes account for most of the failed trades on this pattern.
Trading a V-shaped cup as if it were valid. A sharp, fast dip that snaps straight back up hasn't given the market time to genuinely round out, it's closer to a reflex bounce than a base. Treating it as a full cup and handle setup, with the same conviction as a properly rounded one, is one of the more common ways this pattern gets misread.
Ignoring the volume confirmation on breakout. A close above handle resistance on unremarkable volume is a weaker signal than the same close on a visible spike. Traders who skip the volume check often end up in breakouts that fail to hold, because the move wasn't backed by real buying interest.
Not sizing the position for the leverage involved. The distance from entry to stop-loss only tells you the risk in price terms, combined with the leverage in use, it's also what determines how large the position should actually be. A trader who sizes a leveraged breakout trade the same way they'd size an unleveraged one is taking on far more risk than they realize. Two traders can take the identical cup and handle setup, with the identical stop-loss distance, and end up with wildly different risk exposure purely because one sized their position for the leverage in play and the other didn't. Ouinex's guide to risk management covers this calculation in more detail.
FAQ: Cup and Handle Pattern Questions Answered
How long does a cup and handle pattern take to form?
There's no fixed timeframe. The cup alone can take anywhere from several weeks to several months on daily charts, since it needs enough time to round out genuinely rather than reflect a sharp reflex move. On shorter intraday timeframes, like the four-hour or hourly chart common in crypto trading, the same pattern can complete in days rather than months. The handle itself is typically much shorter than the cup, often one to four weeks on daily charts.
What's the difference between a cup and handle and a rounding bottom?
A rounding bottom is essentially the cup shape on its own: a gradual U-shaped reversal with no handle attached, typically read as its own reversal pattern rather than a continuation setup. A cup and handle adds the second component: a shallow pullback and consolidation after the cup completes, which is what turns it into a continuation pattern with a defined entry trigger, rather than just a broader shift in trend.
Does the cup and handle pattern work in crypto trading?
yes, the pattern is asset-agnostic, and cup and handle setups appear regularly on crypto charts, including Bitcoin and major altcoin perpetuals. Crypto's typically higher volatility can make the cup and handle's proportions look a little less textbook than on a stock chart, which is part of why volume confirmation on the breakout matters even more in crypto than in traditional markets.
What is an inverse cup and handle pattern?
The inverse cup and handle is the bearish mirror image of the standard pattern, an inverted U-shaped top followed by a short upward-drifting handle, typically forming within a downtrend. It signals the decline is likely to resume once price closes below the handle's support, and it follows the same volume and depth guidelines as the bullish version, just flipped in direction.
Sources
1. Cup With Handle, ChartSchool, StockCharts.com
2. Bulkowski on the Cup with Handle, ThePatternSite.com
Not financial advice. Crypto is highly volatile and may drop in value significantly. You may lose the amounts you invest and your investments do not benefit from any form of financial protection.